Real-time Monitoring of Crop Planting
Note
Before running the model, please download the PASTIS dataset from PASTIS official website and place it in the ./UTAE/data/ folder.
# Semantic segmentation task
python train_semantic.py \
  --dataset_folder "./data/PASTIS" \
  --epochs 100 \
  --batch_size 2 \
  --num_workers 0 \
  --display_step 10
# Panoptic segmentation task
python train_panoptic.py \
  --dataset_folder "./data/PASTIS" \
  --epochs 100 \
  --batch_size 2 \
  --num_workers 0 \
  --warmup 5 \
  --l_shape 1 \
  --display_step 10
# Semantic segmentation task
wget -c https://paddle-org.bj.bcebos.com/paddlescience/models/utae/semantic.pdparams -P ./pretrained/
python test_semantic.py \
  --weight_file ./pretrained/semantic.pdparams \
  --dataset_folder "./data/PASTIS" \
  --device gpu
  --num_workers 0
# Panoptic segmentation task
wget -c https://paddle-org.bj.bcebos.com/paddlescience/models/utae/panoptic.pdparams -P ./pretrained/
python test_panoptic.py \
  --weight_folder ./pretrained/panoptic.pdparams \
  --dataset_folder ./data/PASTIS \
  --batch_size 2 \
  --num_workers 0 \
  --device gpu
| Pretrained Model | Metrics |
|---|---|
| Semantic segmentation task | OA (Over all Accuracy): 86.7% mIoU (mean Intersection over Union): 72.6% |
| Panoptic segmentation task | SQ (Segmentation Quality): 83.8 RQ (Recognition Quality): 58.9 PQ (Panoptic Quality): 49.7 |
Background Introduction
Efficient and accurate monitoring of crop planting distribution and growth status is a core requirement in the field of modern smart agriculture and food security. Traditional manual survey methods are time-consuming and labor-intensive, and methods using single-phase satellite images are difficult to deal with cloud cover problems, nor can they capture the dynamic changes of crops throughout the growth cycle.
Satellite Image Time Series (SITS) technology provides a new way to solve this problem. By continuously collecting multi-spectral images of the same area at different times, SITS data contains spectral and texture information of the whole process of crops from sowing, emergence, growth, maturity to harvest. However, SITS data has characteristics such as long time series, high dimensionality, and strong spatiotemporal correlation. How to efficiently extract features from it and perform accurate pixel-level classification (semantic segmentation) is a major technical challenge.
This project is based on the model U-TAE (U-Net Temporal Attention Encoder), implemented using the PaddlePaddle deep learning framework, aiming to build an end-to-end solution to perform semantic segmentation on satellite image time series in the PASTIS dataset, thereby achieving automated and high-precision identification and monitoring of multiple crop planting conditions. This technology can be widely used in agricultural resource surveys, yield estimation, disaster assessment and other fields, and has important practical value.
Model Principle
This chapter only briefly introduces the model principle of U-TAE. For detailed theoretical derivation, please refer to the paper: Panoptic Segmentation of Satellite Image Time Series with Convolutional Temporal Attention Networks
1. Overall Structure
UTAE (U-Net Temporal Attention Encoder) adopts an encoder-decoder architecture, specifically designed for semantic segmentation of satellite image time series:
- Encoder: Uses lightweight ResNet-18 to extract spatial features of single time phase.
- Decoder: Integrates U-TAE module, using temporal attention mechanism to aggregate global context information of multiple time phases.
- Output: Generates a pixel-level category probability map with the same resolution as the input.
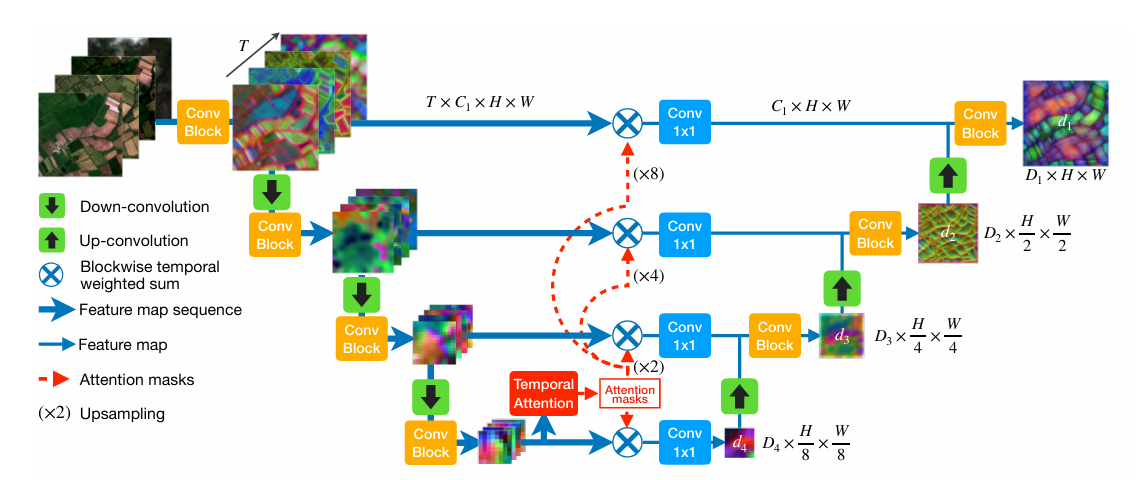
2. Temporal Attention
For a frame sequence of length \(T\), UTAE calculates inter-frame similarity weights for each frame in the decoding stage to achieve adaptive temporal information aggregation:
- Query: Feature of current frame \(\mathbf{Q}\)
- Key / Value: Features of all frames \(\mathbf{K}, \mathbf{V}\)
Calculation steps are as follows:
Then, use these weights to perform weighted summation on the features of all frames to obtain aggregated features:
This mechanism can automatically suppress low-quality frames such as clouds and shadows, and improve the clarity of crop boundaries.
3. Global-Local Temporal Block (GLTB)
Each decoder layer contains two parallel branches:
-
Global Branch: Adopts Multi-Head Self-Attention mechanism to model long-range dependencies at the field level.
-
Local Branch: Uses \(3 \times 3\) depthwise separable convolution, focusing on the preservation of edge and detail information.
The outputs of the two branches are fused by element-wise addition, which preserves both global context and local texture details.
4. Real-time Inference Optimization
To achieve efficient real-time inference, the model adopts the following optimization strategies:
- Lightweight Backbone: ResNet-18, parameter amount less than 12M.
- Inter-frame Shared Weights: In the same sequence, Key and Value are calculated only once to avoid repeated calculation.
- Sliding Window Inference: Divide large images into multiple blocks for block-by-block inference to ensure constant video memory usage.
Dataset Introduction
PASTIS dataset, which consists of 2433 multi-spectral image sequences of shape \(10\times128\times128\). Each sequence contains 38 to 61 observation points between September 2018 and November 2019, totaling more than 2 billion pixels. The acquisition interval is uneven, averaging 5 days. This lack of regularity is due to the automatic filtering of acquisitions with heavy cloud cover by satellite data providers. The dataset covers more than 4,000 square kilometers, and the images come from four different regions in France, with diverse climates and crop distributions. The dataset can be downloaded from PASTIS official website.
Model Implementation
Model Construction
This case is implemented based on UTAE (U-TAE), encapsulated with PaddleScience as follows:
| examples/UTAE/src/backbones/utae.py | |
|---|---|
12 13 14 15 16 17 18 19 20 21 22 23 24 25 26 27 28 29 30 31 32 33 34 35 36 37 38 39 40 41 42 43 44 45 46 47 48 49 50 51 52 53 54 55 56 57 58 59 60 61 62 63 64 65 66 67 68 69 70 71 72 73 74 75 76 77 78 79 80 81 82 83 84 85 86 87 88 89 90 91 92 93 94 95 96 97 98 99 100 101 102 103 104 105 106 107 108 109 110 111 112 113 114 115 116 117 118 119 120 121 122 123 124 125 126 127 128 129 130 131 132 133 134 135 136 137 138 139 140 141 142 143 144 145 146 147 148 149 150 151 152 153 154 155 156 157 158 159 160 161 162 163 164 165 166 167 168 169 170 171 172 173 174 175 176 177 | |
Visualization Results
On the PASTIS dataset, this case reproduces the visualization results of panoptic segmentation prediction and semantic segmentation prediction as shown in the figure:
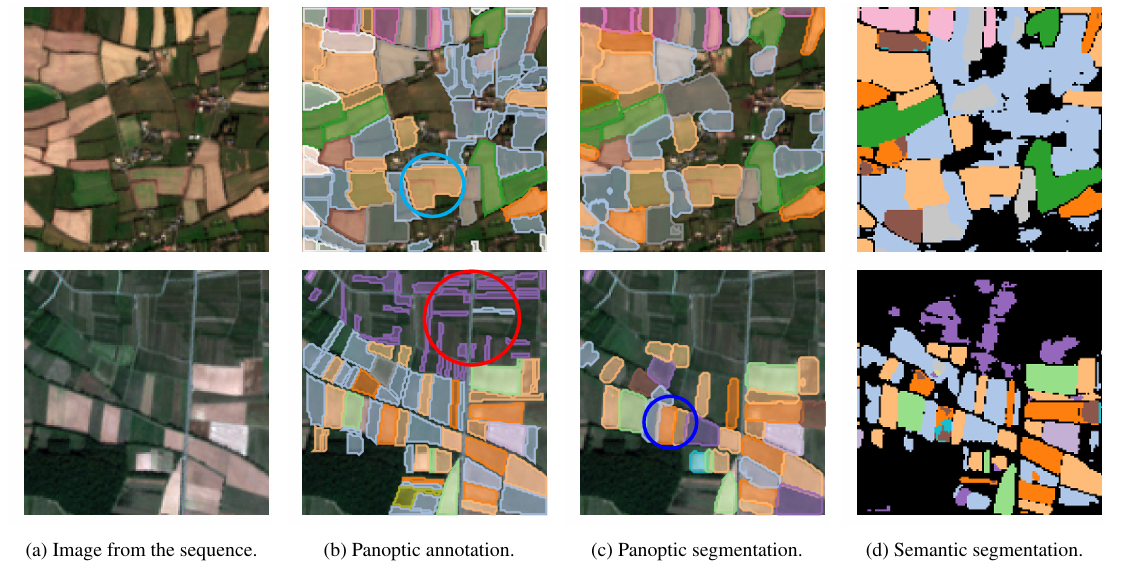
(a) Original image (b) Annotation (Ground Truth) (c) Panoptic segmentation prediction (d) Semantic segmentation prediction
The figure above shows the farmland plot segmentation results on the PASTIS dataset. Different plots are represented by different colors in the figure. The position circled in green represents that a large plot is incorrectly identified as a single plot; the position circled in red represents that many slender plots are not correctly detected; the position circled in blue shows that panoptic segmentation is superior to semantic segmentation. The model performs well in regional boundary detection, especially in the recovery of complex boundaries. However, when facing slender, broken or complex plots, there are still challenges, which easily lead to a decrease in confidence or detection failure.
References
- U-TAE Original Paper: Panoptic Segmentation of Satellite Image Time Series with Convolutional Temporal Attention Networks
- Source Code Implementation: https://github.com/VSainteuf/utae-paps
- Dataset and Benchmark: https://github.com/VSainteuf/pastis-benchmark