UNetFormer
Note
- Before running, it is recommended to quickly understand Dataset and Data Reading Method.
- Download [Vaihingen Dataset] to the corresponding subdirectory in
datadirectory (e.g.data/vaihingen/train_images). - Run tools/vaihingen_patch_split.py to process the original dataset and get trainable data.
The file dataset structure is as follows
airs
├── unetformer(code)
├── model_weights (save the model weights trained on ISPRS vaihingen)
├── fig_results (save the masks predicted by models)
├── lightning_logs (CSV format training logs)
├── data
│   ├── vaihingen
│   │   ├── train_images (original)
│   │   ├── train_masks (original)
│   │   ├── test_images (original)
│   │   ├── test_masks (original)
│   │   ├── test_masks_eroded (original)
│   │   ├── train (processed)
│   │   ├── test (processed)
# Download [Vaihingen Dataset] to the corresponding subdirectory in `data` directory (e.g. `data/vaihingen/train_images`)
# Create training dataset
python tools/vaihingen_patch_split.py --img-dir "data/vaihingen/train_images" --mask-dir "data/vaihingen/train_masks" --output-img-dir "data/vaihingen/train/images_1024" --output-mask-dir "data/vaihingen/train/masks_1024" --mode "train" --split-size 1024 --stride 512
# Create test dataset
python tools/vaihingen_patch_split.py --img-dir "data/vaihingen/test_images" --mask-dir "data/vaihingen/test_masks_eroded" --output-img-dir "data/vaihingen/test/images_1024" --output-mask-dir "data/vaihingen/test/masks_1024" --mode "val" --split-size 1024 --stride 1024 --eroded
# Create masks_1024_rgb visualization dataset
python tools/vaihingen_patch_split.py --img-dir "data/vaihingen/test_images" --mask-dir "data/vaihingen/test_masks" --output-img-dir "data/vaihingen/test/images_1024" --output-mask-dir "data/vaihingen/test/masks_1024_rgb" --mode "val" --split-size 1024 --stride 1024 --gt
# Model training
python train_supervision.py -c config/vaihingen/unetformer.py
# Download processed [Vaihingen Test Dataset](https://paddle-org.bj.bcebos.com/paddlescience/datasets/unetformer/test.zip), and unzip.
wget -c https://paddle-org.bj.bcebos.com/paddlescience/datasets/unetformer/test.zip -P ./data/vaihingen/
unzip -q ./data/vaihingen/test.zip -d data/vaihingen/
# Download pretrained model file
wget -c https://paddle-org.bj.bcebos.com/paddlescience/models/unetformer/unetformer-r18-512-crop-ms-e105_epoch0_best.pdparams -P ./model_weights/vaihingen/unetformer-r18-512-crop-ms-e105/
python vaihingen_test.py -c config/vaihingen/unetformer.py -o fig_results/vaihingen/unetformer --rgb
1. Background Introduction
Semantic segmentation of remote sensing urban scene images has wide demands in many practical applications, such as land cover mapping, urban change detection, environmental protection and economic evaluation. Driven by the rapid development of deep learning technology, Convolutional Neural Networks (CNN) have dominated the field of semantic segmentation for many years. CNN adopts hierarchical feature representation and shows strong local information extraction ability. However, the local nature of the convolutional layer limits the network's ability to capture global context information. In recent years, as a hot research direction in the field of computer vision, Transformer architecture has shown great potential in global information modeling, significantly improving the performance of vision-related tasks such as image classification, object detection, and especially semantic segmentation.
This paper proposes a Transformer-based decoder architecture and constructs a UNet-like Transformer network (UNetFormer) for real-time urban scene segmentation. To achieve efficient segmentation, UNetFormer selects lightweight ResNet18 as the encoder and develops an efficient global-local attention mechanism in the decoder to model global and local information simultaneously. The Transformer-based decoder proposed in this paper combined with Swin Transformer encoder also achieved the current best performance (91.3% F1 score and 84.1% mIoU) on the Vaihingen dataset.
2. Model Principle
This paragraph only briefly introduces the model principle. For specific details, please read UNetFormer: A UNet-like Transformer for Efficient Semantic Segmentation of Remote Sensing Urban Scene Imagery.
2.1 Model Structure
UNetFormer is a deep learning network based on transformer decoder. The figure below shows the overall structure of the model.
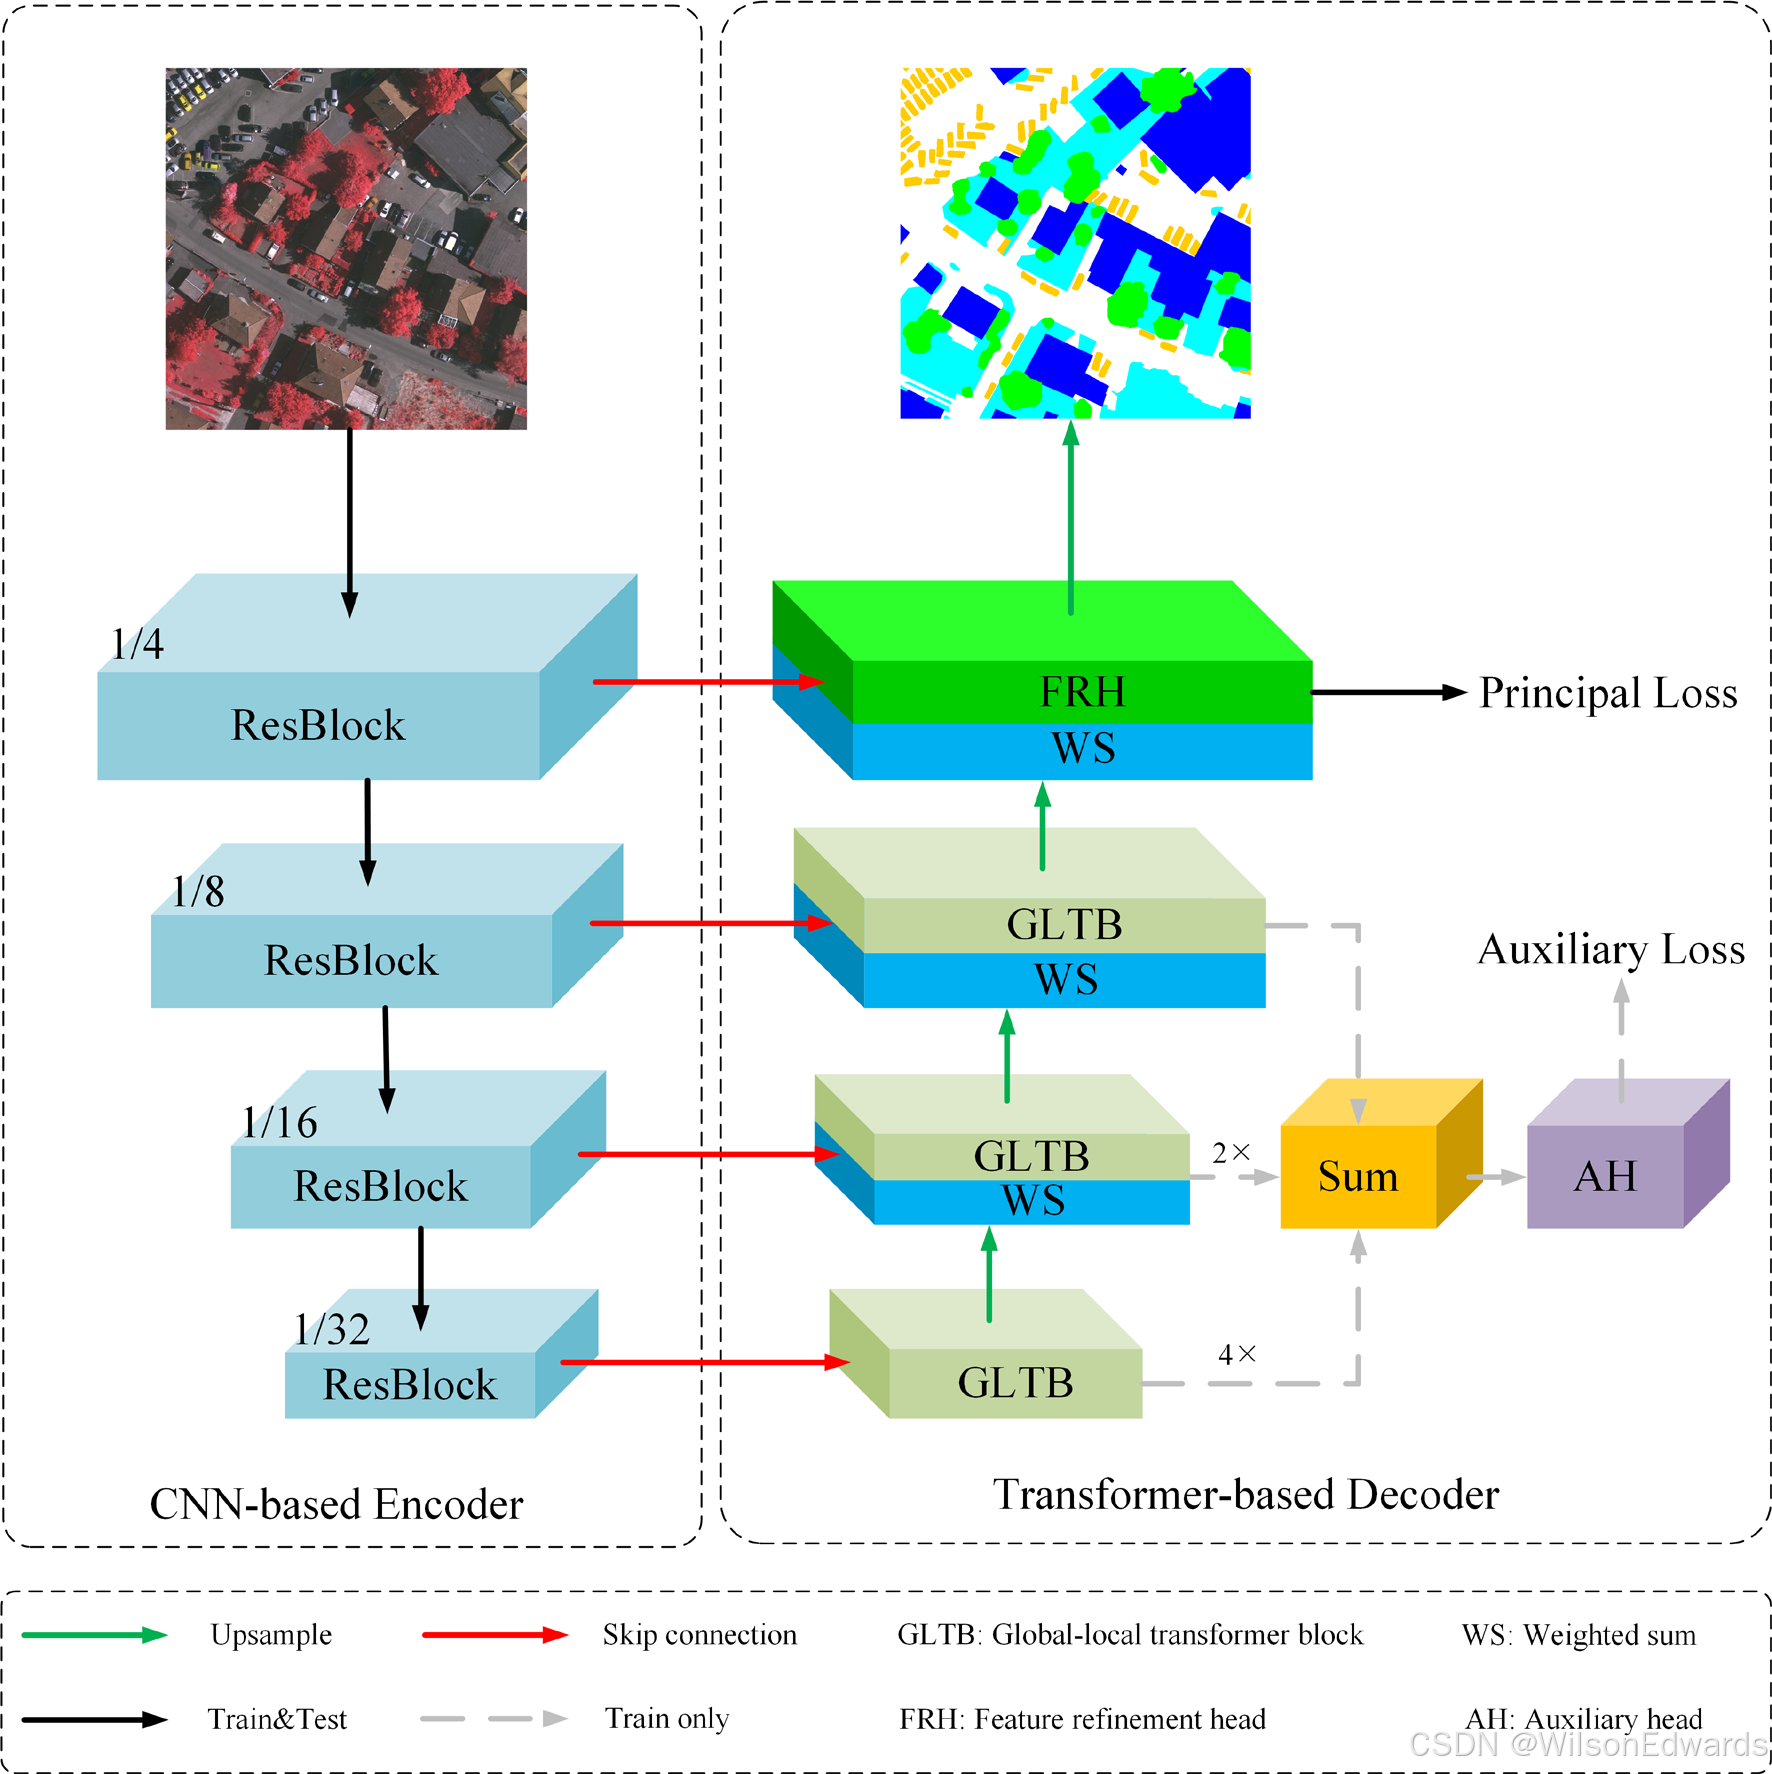
-
ResBlockis each module of resnet18 network. -
GLTBconsists of global-local attention, MLP, two batchnorm layers and two sum operations.
2.2 Loss Function
The discriminator's loss function consists of two parts. The main loss function \(\mathcal{L}_{\text {p }}\) is SoftCrossEntropyLoss cross entropy loss function \(\mathcal{L}_{c e}\) and DiceLoss loss function \(\mathcal{L}_{\text {dice }}\). Its expression is:
Where N and K respectively represent the number of samples and the number of categories. \(y^{(n)}\) and \(\hat{y}^{(n)}\) represent the one-hot encoding of the label and the corresponding softmax output, \(\mathrm{n} \in[1, \ldots, \mathrm{n}]\).
In order to combine better, we choose the cross entropy function as the auxiliary loss function \({L}_{a u x}\), and multiply by the coefficient \(\alpha\). The expression of the total loss function is:
Where \(\alpha\) defaults to 0.4.
3. Model Construction
Below we explain the key parts of building UnetFormer using PaddleScience.
3.1 Dataset Introduction
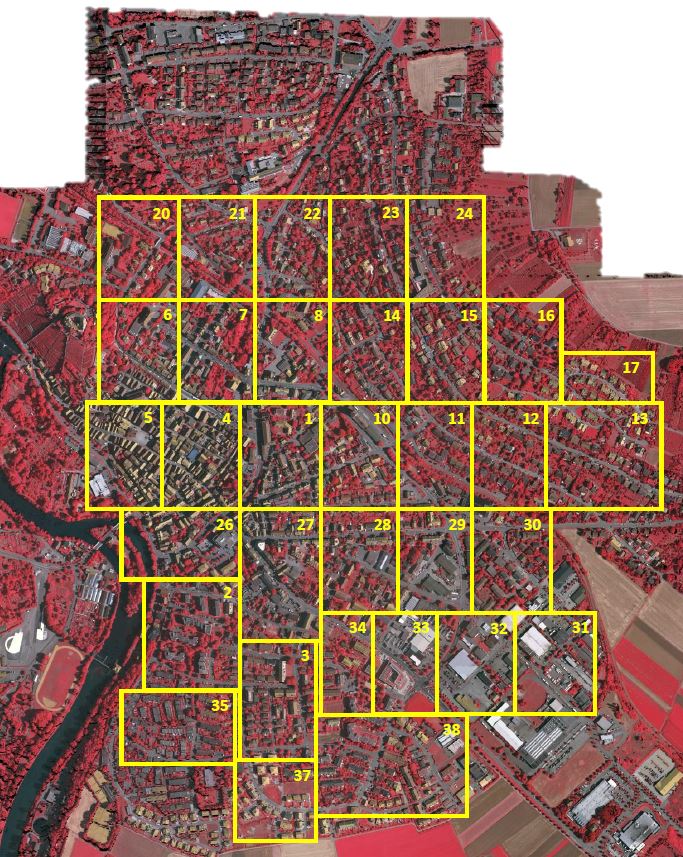
The dataset uses Vaihingen dataset open sourced by ISPRS.
ISPRS provides two state-of-the-art airborne image datasets for urban classification and 3D building reconstruction test projects. This dataset uses digital surface models (DSM) generated by high-resolution orthophotos and corresponding dense image matching techniques. Both dataset areas cover urban scenes. Vaihingen is a relatively small village with many independent buildings and small multi-story buildings. This dataset contains 33 remote sensing images of different sizes, each extracted from a larger top-level orthophoto image. The image selection process avoids the situation of no data. The spatial resolution of the top-level image and DSM is 9 cm. Remote sensing image format is 8-bit TIFF file, consisting of 3 bands: near infrared, red and green. DSM is a single-band TIFF file, and the gray level (corresponding to DSM height) is 32-bit floating point value encoding.
Each dataset has been manually classified into 6 most common land cover categories.
① Impervious surface (RGB: 255, 255, 255)
② Building (RGB: 0, 0, 255)
③ Low vegetation (RGB: 0, 255, 255)
④ Tree (RGB: 0, 255, 0)
⑤ Car (RGB: 255, 255, 0)
⑥ Background (RGB: 255, 0, 0)
The background class includes water bodies and objects different from other defined categories (such as containers, tennis courts, swimming pools), which usually belong to semantic objects of no interest in urban scenes.
3.2 Build dataset API
Since a dataset consists of 33 ultra-large remote sensing images. In order to facilitate training, we customize an image segmentation program to segment the original image into 1024×1024 size trainable images. The specific information of the program code can be seen in GeoSeg/tools/vaihingen_patch_split.py.
3.3 Model Construction
The model construction code for this case is as follows
Parameter configuration is as follows:
3.4 loss function
UNetFormer's loss function consists of SoftCrossEntropyLoss cross entropy loss function and DiceLoss loss function
3.4.1 SoftCrossEntropyLoss
3.4.2 DiceLoss
36 37 38 39 40 41 42 43 44 45 46 47 48 49 50 51 52 53 54 55 56 57 58 59 60 61 62 63 64 65 66 67 68 69 70 71 72 73 74 75 76 77 78 79 80 81 82 83 84 85 86 87 88 89 90 91 92 93 94 95 96 97 98 99 100 101 102 103 104 105 106 107 108 109 110 111 112 113 114 115 116 117 118 119 120 121 122 123 124 125 126 127 128 129 130 131 132 133 134 135 136 137 138 139 140 141 142 143 144 145 | |
3.4.3 JointLoss
SoftCrossEntropyLoss and DiceLoss will be combined using JointLoss
3.4.4 UNetFormerLoss
3.5 Optimizer Construction
UNetFormer uses AdamW optimizer, which can be directly constructed by calling paddle.optimizer.AdamW, code as follows:
3.6 Model Training
3.7 Model Testing
4. Result Display
Training results using Vaihingen dataset.
| F1 | mIOU | OA |
|---|---|---|
| 0.9062 | 0.8318 | 0.9283 |
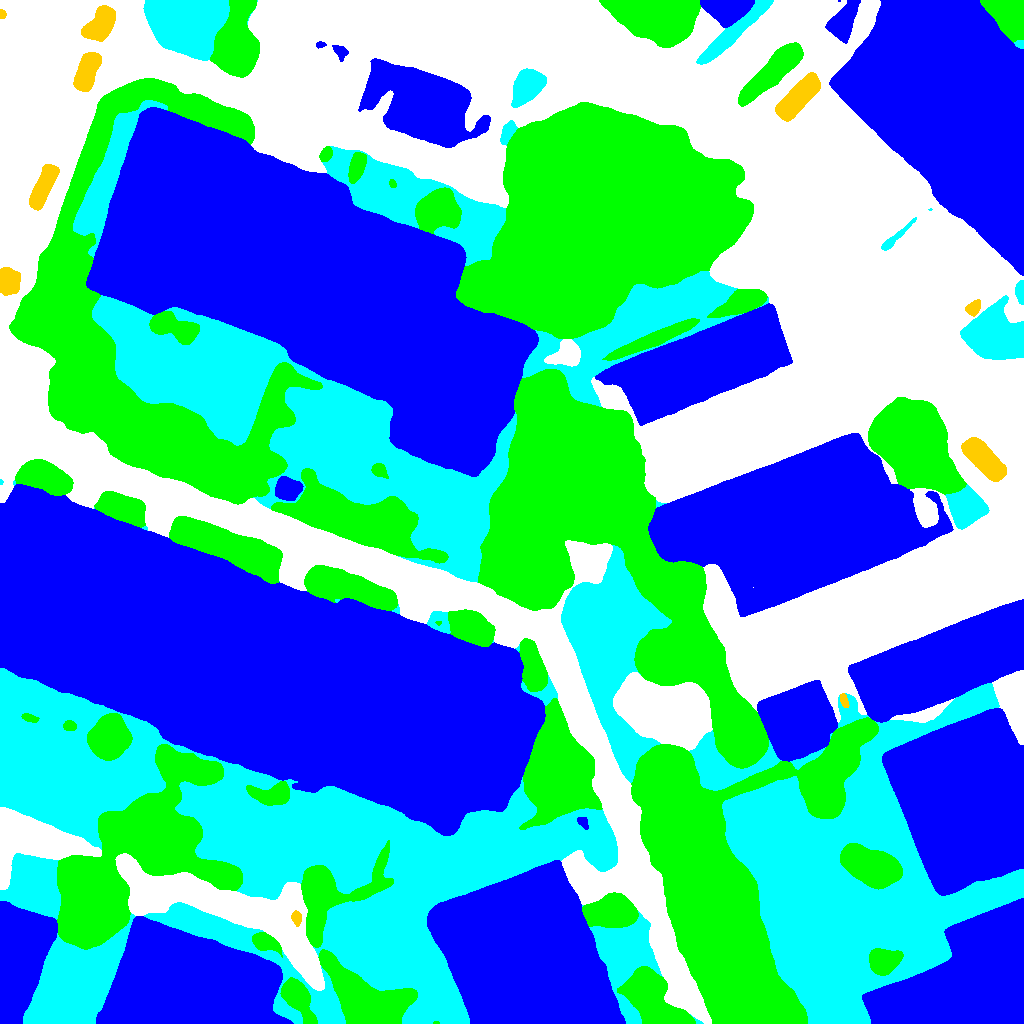
Comparing the two pictures, it can be seen that the model has accurately segmented the contours of buildings, trees, cars and other objects in remote sensing images, and handled overlapping areas well.