DrivAerNet++¶
DrivAerNet++: A Large-Scale Multimodal Car Dataset with Computational Fluid Dynamics Simulations and Deep Learning Benchmarks
Paper Information¶
| Year | Conference | Author | Citations | Paper PDF |
|---|---|---|---|---|
| 2024 | Conference and Workshop on Neural Information Processing Systems | Mohamed Elrefaie, Florin Morar, Angela Dai, Faez Ahmed | 4 | DrivAerNet++: A Large-Scale Multimodal Car Dataset with Computational Fluid Dynamics Simulations and Deep Learning Benchmarks |
Code Information¶
| Pretrained Model | Neural Network | Metrics |
|---|---|---|
| DragPrediction_DrivAerNet_PointNet_r2_batchsize16_200epochs_100kpoints_tsne_NeurIPS_best_model.pdparams | RegPointNet | \(R^2:91.93%\) |
mkdir -p data/subset_dir
wget -c https://dataset.bj.bcebos.com/PaddleScience/DNNFluid-Car/DrivAer%2B%2B/DrivAer%2B%2B_Points.tar
tar -xvf DrivAer++_Points.tar -C ./data
wget -c https://dataset.bj.bcebos.com/PaddleScience/DNNFluid-Car/DrivAer%2B%2B/DrivAerNetPlusPlus_Drag_8k.csv -P ./data
wget -c https://dataset.bj.bcebos.com/PaddleScience/DNNFluid-Car/DrivAer%2B%2B/test_design_ids.txt -P ./data/subset_dir
wget -c https://dataset.bj.bcebos.com/PaddleScience/DNNFluid-Car/DrivAer%2B%2B/train_design_ids.txt -P ./data/subset_dir
wget -c https://dataset.bj.bcebos.com/PaddleScience/DNNFluid-Car/DrivAer%2B%2B/val_design_ids.txt -P ./data/subset_dir
mv ./data/workspace/gino_data/14_DrivAer++/paddle_tensor ./data/DrivAerNetPlusPlus_Processed_Point_Clouds_100k_paddle
rm -rf data/workspace

python drivaernetplusplus.py
mkdir -p data/subset_dir
wget -c https://dataset.bj.bcebos.com/PaddleScience/DNNFluid-Car/DrivAer%2B%2B/DrivAer%2B%2B_Points.tar
tar -xvf DrivAer++_Points.tar -C ./data
wget -c https://dataset.bj.bcebos.com/PaddleScience/DNNFluid-Car/DrivAer%2B%2B/DrivAerNetPlusPlus_Drag_8k.csv -P ./data
wget -c https://dataset.bj.bcebos.com/PaddleScience/DNNFluid-Car/DrivAer%2B%2B/test_design_ids.txt -P ./data/subset_dir
wget -c https://dataset.bj.bcebos.com/PaddleScience/DNNFluid-Car/DrivAer%2B%2B/train_design_ids.txt -P ./data/subset_dir
wget -c https://dataset.bj.bcebos.com/PaddleScience/DNNFluid-Car/DrivAer%2B%2B/val_design_ids.txt -P ./data/subset_dir
mv ./data/workspace/gino_data/14_DrivAer++/paddle_tensor ./data/DrivAerNetPlusPlus_Processed_Point_Clouds_100k_paddle
rm -rf data/workspace

python drivaernetplusplus.py mode=eval EVAL.pretrained_model_path=https://dataset.bj.bcebos.com/PaddleScience/DNNFluid-Car/DrivAer%2B%2B/DragPrediction_DrivAerNet_PointNet_r2_batchsize16_200epochs_100kpoints_tsne_NeurIPS_best_model.pdparams
Correction¶
Discussion on the Correctness of R² Calculation¶
In machine learning and deep learning, R² (coefficient of determination) is a commonly used metric for evaluating regression models. It measures the degree of fit between model predictions and true values. The formula for calculating R² is:
Where:
- \(SS_{res}\) is the sum of squared residuals, representing the difference between predicted and true values.
- \(SS_{tot}\) is the total sum of squares, representing the difference between true values and their mean.
Problem: Unreasonableness of Calculating R² Based on Batches¶
In some implementations, R² may be calculated for each batch individually and then aggregated. This approach is mathematically unreasonable for the following reasons:
-
Intra-batch Variance vs. Global Variance:
-
When calculating R² within each batch, \(SS_{tot}\) is calculated based on the mean of true values within that batch. This causes \(SS_{tot}\) to reflect only intra-batch variance, ignoring the global variance of the entire dataset.
-
Since data distributions may vary across batches, the mean and variance within a batch can differ significantly, leading to inaccurate R² estimates.
-
Impact of Batch Size:
- If different batch sizes are used, R² results can vary significantly. For example, smaller batches may lead to larger variances, affecting R² calculation. Therefore, batch-based R² calculation results depend on the choice of batch size and lack stability.
# R² calculation in source code DeepSurrogates/train_RegPointNet.py
def r2_score(output, target):
"""Compute R-squared score."""
target_mean = torch.mean(target)
ss_tot = torch.sum((target - target_mean) ** 2)
ss_res = torch.sum((target - output) ** 2)
r2 = 1 - ss_res / ss_tot
return r2

with torch.no_grad():
    for data, targets in test_dataloader:
        start_time = time.time()  # Start time for inference

        data, targets = data.to(device), targets.to(device).squeeze()

        data = data.permute(0, 2, 1)
        outputs = model(data)

        end_time = time.time()  # End time for inference
        inference_time = end_time - start_time
        total_inference_time += inference_time  # Accumulate total inference time
        # print(outputs)
        # print(targets)
        mse = F.mse_loss(outputs, targets)  # Mean Squared Error (MSE)
        mae = F.l1_loss(outputs, targets)  # Mean Absolute Error (MAE),
        r2 = r2_score(outputs, targets)  # R-squared

        # Accumulate metrics to compute averages later
        total_mse += mse.item()
        total_mae += mae.item()
        total_r2 += r2.item()
        max_mae = max(max_mae, mae.item())
        total_samples += targets.size(0)  # Increment total sample count

print(total_mse)
print(total_mae)
print(len(test_dataloader))
# Compute average metrics over the entire test set
avg_mse = total_mse / len(test_dataloader)
avg_mae = total_mae / len(test_dataloader)
avg_r2 = total_r2 / len(test_dataloader)
Correct Approach: Calculating R² Based on All Data¶
To ensure accurate and stable R² calculation, R² should be calculated based on the entire dataset (rather than individual batches). The specific steps are as follows:
-
Collect all predicted and true values:
-
During training or validation, collect predicted and true values from all batches to form a complete list of predicted values \(y_{pred}\) and true values \(y_{true}\).
-
Calculate Global Mean:
-
Calculate the global mean \(y_{mean}\) using the true values \(y_{true}\) of the entire dataset, rather than local means within each batch.
-
Calculate Global \(SS_{tot}\) and \(SS_{res}\):
-
Calculate the total sum of squares \(SS_{tot}\) and residual sum of squares \(SS_{res}\) using the global mean \(y_{mean}\).
-
Calculate Final R²:
- Calculate the final R² using global \(SS_{tot}\) and \(SS_{res}\).
1. Background Introduction¶
This study presents DrivAerNet++, currently the largest and most comprehensive multimodal dataset for aerodynamic car design. DrivAerNet++ includes 8000 diverse car designs modeled using high-fidelity computational fluid dynamics (CFD) simulations. The dataset includes different car configurations such as fastback, notchback, and estateback, with varying chassis and wheel designs to represent internal combustion engine and electric vehicles. Each entry in the dataset features detailed 3D meshes, parametric models, aerodynamic coefficients, and extensive flow field and surface field data, as well as segmented parts and point cloud data for car classification. The dataset supports a wide range of machine learning applications, including data-driven design optimization, generative modeling, surrogate model training, CFD simulation acceleration, and geometric classification. With over 39TB of publicly available engineering data, DrivAerNet++ fills a significant gap in available resources, providing high-quality, diverse data to enhance model training, facilitate generalization, and accelerate the automotive design process. In addition to rigorous dataset validation, this study also provides ML benchmark results on the aerodynamic drag prediction task, demonstrating the breadth of applications supported by the dataset of this study. The dataset will have a significant impact on automotive design and broader engineering disciplines by fostering innovation and improving the fidelity of aerodynamic assessments.
Automotive design is a complex and iterative process requiring close collaboration between designers and engineers, with designers focusing on aesthetics and engineers ensuring designs meet performance constraints. One of the key challenges is balancing aesthetic appeal with aerodynamic efficiency, which directly impacts fuel consumption. With increasingly stringent fuel consumption regulations for internal combustion engine (ICE) vehicles and increasing range requirements for battery electric vehicles (BEV) [46, 8, 44], ensuring efficient vehicle aerodynamic performance has become paramount. Consequently, there is significant interest in developing machine learning methods for automotive aerodynamic modeling.
Data-driven methods can greatly shorten the process required to obtain performance estimates, which typically involves generating 3D meshes, ensuring watertightness and simulation readiness, performing CFD meshing, defining solvers and boundary conditions, running CFD, and post-processing results. By streamlining these steps, data-driven methods improve efficiency and speed up the design process. This allows designers to explore various ideas through real-time, accurate performance estimates, ultimately improving outcomes with greater design freedom. Recent advances in geometric deep learning methods [57, 56, 55, 1, 39, 66, 61, 6] demonstrate their ability to quickly estimate performance values from CFD, thereby facilitating interactive design modifications. However, due to the lack of public datasets, these methods are often limited to simple problems, restricting their broader applicability.
Existing datasets typically focus on simpler 2D cases [7, 64, 21, 68, 39, 29] or simplified 3D models [6, 55, 43, 67, 58, 61, 66], often excluding key components such as wheels, mirrors, and underbody. As highlighted in [32], including these elements significantly affects aerodynamic performance, leading to substantial increases in drag. In CFD simulations, drag values increase by approximately 142%, and in wind tunnel experiments, drag values increase by 120%. This highlights the critical role of comprehensive 3D modeling in achieving accurate aerodynamic assessment. Furthermore, approximately 25% of aerodynamic drag in passenger cars is directly or indirectly attributed to wheels [9]. Additionally, many large-scale datasets [61, 67] lack experimental validation of baseline simulations through physical wind tunnel testing, as well as validation of individual convergence for each simulation.
The significant lack of publicly available, large-scale, multimodal automotive datasets hinders progress in data-driven design. This contrasts with other fields where standardized datasets such as ImageNet [18], ObjectNet3D [73], ModelNet [72], and ScanNet [16] have driven significant advancements.
This study addresses these challenges using the DrivAerNet++ 2 dataset (see Figure 1). The DrivAerNet++ dataset represents a significant advancement over its predecessor, the DrivAerNet dataset [22], which integrated 4000 diverse car shapes. This improvement doubles the dataset volume to a total of 8000 industry-standard car designs and significantly enhances simulation fidelity with more complex cell structures (24M cells versus 8-16M in the original dataset). Furthermore, DrivAerNet++ expands its utility by incorporating detailed 3D flow field data, parametric data, aerodynamic performance coefficients, and partial annotations. The dataset encompasses a wide range of geometries and configurations, covering most conventional car design categories, including detailed chassis for traditional ICE vehicles and smooth chassis for electric vehicles.
Large-scale, diverse, and high-fidelity datasets are crucial for advancing deep learning methods in CFD and engineering design, providing standardized data for development, validation, and comparison of new methods. Emerging datasets such as AirfRANS [7], BubbleML [30], Lagrangebench [65], and BLASTNet [13] have made significant contributions to the machine learning community in fluid mechanics by providing comprehensive data for training and benchmarking. In engineering design, aircraft design datasets (such as Aircraft Verse [14]) provide detailed and diverse aircraft design configurations, helping engineers validate new design strategies and ensure high performance. However, there is currently no large-scale 3D shape dataset combining high-fidelity CFD simulations tailored specifically for automotive aerodynamic design.
The comparison presented in Table 1 supports the motivation of this study by highlighting the lack of open-source datasets containing comprehensive features for data-driven aerodynamic design. This gap underscores the need for datasets that not only provide high-fidelity simulations but also ensure experimental validation to confirm the accuracy and reliability of computational models. DrivAerNet++ addresses these needs by incorporating multiple data modalities (3D meshes, point clouds, CFD data, parametric data, and partial annotations) and considering modeling of rotating wheels and underbody. While DrivAerNet [22] is based on a single car category, DrivAerNet++ incorporates multiple car designs and categories.
| Dataset | Size | Aerodynamics Data | Wheels/Underbody Modeling | Parametric Design Parameters | Shape Variation | Experimental Validation | Modalities | Open-source |
|---|---|---|---|---|---|---|---|---|
| Usama et. al 2021 [68] | 500 | ✅❌❌❌❌ | ❌ | ✅ | 40 (2D) | ❌ | P | ❌ |
| Li et. al 2023 [43]* | 551 | ✅❌❌✅✅ | ❌ | ✅ | 6 (3D) | ❌ | M,P,C | ❌ |
| Rios et. al 2021 [58]† | 600 | ✅✅❌❌❌ | ❌ | ❌ | - | ❌ | M,P,C | ❌ |
| Li et. al 2023 [43]† | 611 | ✅❌❌✅✅ | ❌ | ❌ | - | ✅ | M,C | ❌ |
| Umetani et. al 2018 [67]† | 889 | ✅❌✅✅❌ | ❌ | ❌ | - | ✅ | M,C | ✅ |
| Gunpinar et. al 2019 [29] | 1000 | ✅❌❌❌❌ | ❌ | ✅ | 21 (2D) | ❌ | P | ❌ |
| Jacob et. al 2021 [37]* | 1000 | ✅✅✅❌✅ | ✅ | ✅ | 15 (3D) | ✅ | M,C,P | ❌ |
| Trinh et. al 2024 [66] | 1121 | ❌❌✅✅❌ | ❌ | ❌ | - | ❌ | M,C | ❌ |
| Remelli et. al 2020 [53]† | 1400 | ❌❌❌✅❌ | ❌ | ❌ | - | ✅ | M,C | ❌ |
| Baque el al. 2018 [6] | 2000 | ✅❌❌❌❌ | ❌ | ✅ | 21 (3D) | ❌ | M,P | ❌ |
| Song et. al 2023 [63]† | 2474 | ✅❌❌❌❌ | ❌ | ❌ | - | ✅ | M | ✅ |
| DrivAerNet [22]* | 4000 | ✅✅✅✅✅ | ✅ | ✅ | 50 (3D) | ✅ | M,P,C,P | ✅ |
| DrivAerNet++ (Ours)* | 8000 | ✅✅✅✅✅ | ✅ | ✅ | 26-50 (3D) | ✅ | M,P,C,C,P,A | ✅ |
Table 1: A comprehensive comparison of various aerodynamic datasets, highlighting key aspects such as dataset size, inclusion of aerodynamic coefficients (\(C_d\), \(C_l\)), velocity (\(u\)), pressure (\(p\)), fluid shear stress (\(τw\)) fields, wheel/underbody modeling, parametric study capabilities, number of design parameters, shape variation, experimental validation data, multimodal capabilities, and open-source availability. M refers to 3D meshes, PC to point clouds, P to parametric data, A to partial annotations, and C to CFD data. Datasets based on ShapeNet [11].
In addition, this study describes the limitations of previous datasets:
-
Lack of diversity: Datasets from [37, 43, 22, 6, 20, 60] are based on the same parametric model, resulting in generated cars coming from the same car design. This lack of diversity limits generalization capabilities and creativity in design exploration.
-
Small dataset size: In the engineering design process, changes are not limited to simple geometric parameter adjustments but often involve adding or removing entire components. A significant limitation is the availability of high-quality, watertight meshes required for CFD simulations. Most existing datasets [43, 56, 67, 20] are either based on ShapeNet [11], which contains very few car designs suitable for CFD and features low-resolution characteristics compared to meshes typically used in academia or industry for automotive aerodynamic design; or based on deformed geometries of a single design, such as the Ahmed body [2] or DrivAer body. Consequently, most existing datasets are relatively small, typically on the order of hundreds, with the largest being [61] with 2474 cars.
-
Low simulation fidelity: Due to the expensive computational cost of running high-fidelity CFD simulations, there is a trade-off between dataset size and simulation fidelity. Therefore, existing datasets, such as [61, 6, 55, 56, 68, 29], use lower simulation fidelity, reducing practical utility.
The dataset of this study, DrivAerNet++, attempts to provide both design variation and diversity as well as simulation fidelity, making it highly applicable to the conceptual design phase. This balance ensures that designers can explore a wide range of aerodynamic concepts without sacrificing simulation quality.
2. Problem Definition¶
2.1 Dataset Presentation¶
PaddlePaddle version dataset download:
mkdir -p data/subset_dir
wget -c https://dataset.bj.bcebos.com/PaddleScience/DNNFluid-Car/DrivAer%2B%2B/DrivAer%2B%2B_Points.tar
tar -xvf DrivAer++_Points.tar -C ./data
wget -c https://dataset.bj.bcebos.com/PaddleScience/DNNFluid-Car/DrivAer%2B%2B/DrivAerNetPlusPlus_Drag_8k.csv -P ./data
wget -c https://dataset.bj.bcebos.com/PaddleScience/DNNFluid-Car/DrivAer%2B%2B/test_design_ids.txt -P ./data/subset_dir
wget -c https://dataset.bj.bcebos.com/PaddleScience/DNNFluid-Car/DrivAer%2B%2B/train_design_ids.txt -P ./data/subset_dir
wget -c https://dataset.bj.bcebos.com/PaddleScience/DNNFluid-Car/DrivAer%2B%2B/val_design_ids.txt -P ./data/subset_dir
mv ./data/workspace/gino_data/14_DrivAer++/paddle_tensor ./data/DrivAerNetPlusPlus_Processed_Point_Clouds_100k_paddle
rm -rf data/workspace
Official dataset download:
stl source dataset download tutorial reference, download DrivAerNet++: 3D Meshes from dataset download address, i.e. .stl mesh data. Linux:
-
Globus Connect Personal is a free client provided by Globus. Available for Linux, Mac, and Windows.
-
Download Globus Connect Personal directly using wget or curl:
-
Extract files from the downloaded tarball.
-
Launch Globus Connect Personal. Since it's the first run, setup must be completed before running the full application.
-
Setup process. After running
./globusconnectpersonal, the following content pops up. Get the authentication code through the login URL. After== starting endpoint setup, set the endpoint name and get the endpoint ID serial number.Detected that setup has not run yet, and '-setup' was not used Will now attempt to run globusconnectpersonal -setup Globus Connect Personal needs you to log in to continue the setup process. We will display a login URL. Copy it into any browser and log in to get a single-use code. Return to this command with the code to continue setup. Login here: ----- https://auth.globus.org/Your URL content ----- Enter the auth code: Your authentication code == starting endpoint setup Input a value for the Endpoint Name: The endpoint name you set registered new endpoint, id: Your endpoint ID setup completed successfully -
Run without GUI, start Globus Connect Personal in the background.
-
Check the status of Globus Connect Personal. Use
-statusto view the status of Globus Connect Personal running in the background. -
Add path Globus download path.
-
Add storage path. For more information, please refer to the Globus official tutorial.
-
To use Globus, globus-cli needs to be installed.
-
Login, get authentication code through login URL.
globus login --no-local-server Please authenticate with Globus here: ------------------------------------ https://auth.globus.org/Your URL info ------------------------------------ Enter the resulting Authorization Code here: Authentication code obtained from URL You have successfully logged in to the Globus CLI! You can check your primary identity with globus whoami For information on which of your identities are in session use globus session show Logout of the Globus CLI with globus logout -
Find the name and account of the data to be downloaded, taking PubDAS as an example.
globus endpoint search "PubDAS" --filter-owner-id 4c984b40-a0b2-4d9e-b132-b32 735905e23@clients.auth.globus.org ID | Owner | Display Name ------------------------------------ | ------------------------------------------------------------ | ------------- 706e304c-5def-11ec-9b5c-f9dfb1abb183 | 4c984b40-a0b2-4d9e-b132-b32735905e23@clients.auth.globus.org | PubDAS 1013e4a6-5df1-11ec-bded-55fe55c2cfea | 4c984b40-a0b2-4d9e-b132-b32735905e23@clients.auth.globus.org | PubDAS-upload -
Simplify the ID name of the download data source (optional)
-
View data under this path.
-
Get your own Globus ID.
-
Similarly, simplify your own ID (optional)
-
Download data, transfer License.txt from PubDAS in ep1 data source to ep2 (under your own path, set in steps 8 and 9).
-
Use the Task ID above to view file transfer status!
globus task show -----------------Transfer Task ID-----------------
Label:                        None
Task ID:                      -----------------Transfer Task ID-----------------
Is Paused:                    False
Type:                         TRANSFER
Directories:                  0
Files:                        1
Status:                       SUCCEEDED
Request Time:                 2022-01-24T17:20:07+00:00
Faults:                       0
Total Subtasks:               2
Subtasks Succeeded:           2
Subtasks Pending:             0
Subtasks Retrying:            0
Subtasks Failed:              0
Subtasks Canceled:            0
Subtasks Expired:             0
Subtasks with Skipped Errors: 0
Completion Time:              2022-01-24T17:20:08+00:00
Source Endpoint:              ESnet Read-Only Test DTN at Starlight
Source Endpoint ID:           57218f41-3200-11e8-b907-0ac6873fc732
Destination Endpoint:         Globus Tutorial Endpoint 1
Destination Endpoint ID:      -----------------ID-----------------
Bytes Transferred:            1000000
Bytes Per Second:             587058
Benchmark Geometry Generation: In automotive aerodynamics, production cars are typically classified into three broad categories based on the airflow pattern at the rear end of the car [33, 34]: notchback, fastback, and estateback cars. To ensure the dataset of this study covers the entire design space of most conventional car designs, this study created multiple parametric models with different designs based on the DrivAer model [47]. This includes different rear configurations - fastback, backswept, and notchback - leading to distinct wake structures and flow field patterns. Additionally, this study varied wheels, including open and closed designs, as well as smooth and detailed options. For car underbodies, this study includes both detailed underbodies typical of ICE cars and smooth underbodies suitable for electric vehicles (see Figure 2). By exploring various rear, wheel, and underbody configurations, this study aims to provide a comprehensive understanding of their aerodynamic impact, thereby supporting the development of more robust and generalizable deep learning models. For parametric model creation, this study utilized commercial software ANSA ® to define 26 geometric parameters, allowing this study to deform these parametric models to obtain a large-scale 3D car dataset. The goal of this study is to develop a procedural generator to create topologically valid car designs, ensuring each design meets the necessary requirements for CFD solver evaluation and usability for automotive designers.
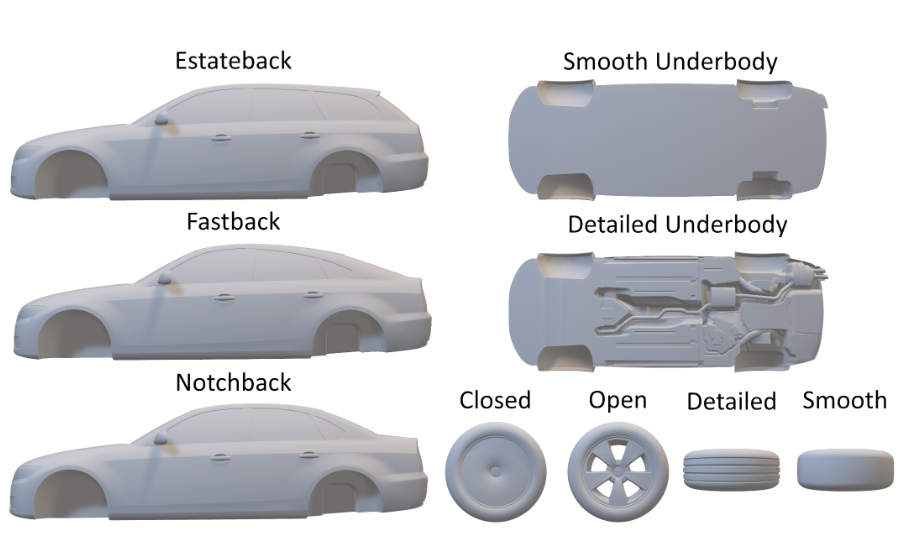
Figure 2: Baseline models of parametric models derived from DrivAerNet++, showcasing a range of shape designs and configurations. Variations include notchback, fastback, and estateback car body types as well as different chassis configurations such as smooth and detailed. Wheel options are presented in closed, open, detailed, and smooth styles.
High-Resolution 3D Industry Standard Design: The design curation of this study involves selecting effective car configurations followed by detailed CFD simulations to assess aerodynamic performance. The goal of this study is to create a balanced dataset containing a wide variety of car designs, ensuring coverage of different aerodynamic performance metrics and aesthetic considerations. Figure 3 shows a subset of design parameters used to generate the DrivAerNet++ dataset. By defining a lower and upper bound for each parameter and deforming the baseline parametric model, this study ensures a comprehensive and well-defined representation suitable for engineering applications and simulations. The design method of this study is diversity-preserving, ensuring optimization does not lead to overly similar designs. To achieve this, this study employed optimal Latin Hypercube sampling for Design of Experiments (DoE). Specifically, this study employs the Enhanced Stochastic Evolutionary Algorithm (ESE) [17] to guarantee efficient sampling of the design space. Using these steps, the diversity of DrivAerNet++ is significantly higher than DrivAerNet [22].
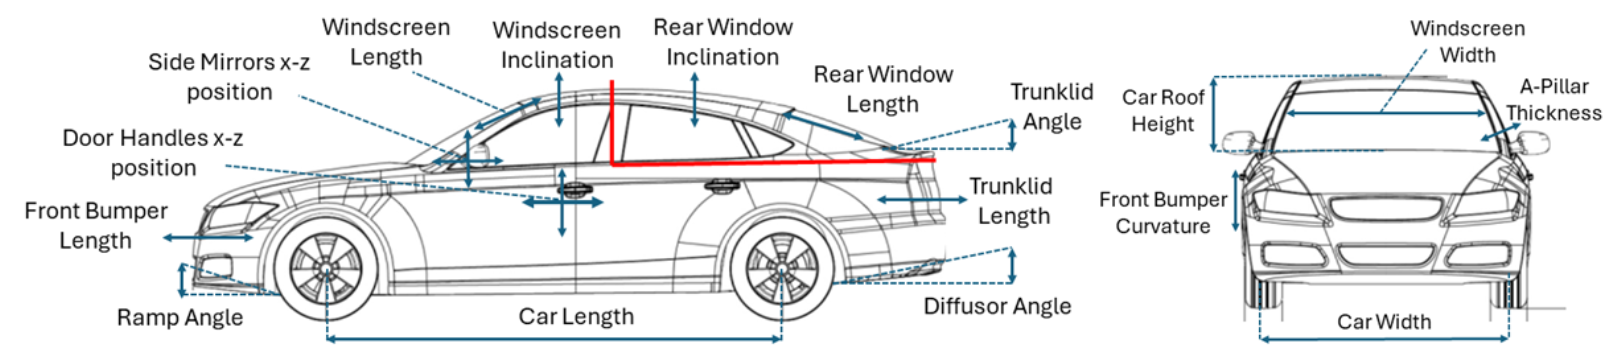
Figure 3: Design parameters generated for the DrivAerNet++ dataset. Several geometric parameters with significant impact on aerodynamic forces were selected and varied within specific ranges. These parameter ranges were chosen to avoid values that are difficult to manufacture or aesthetically unpleasing. Car sketches adapted from [32].
CFD Mesh Generation: For mesh generation, this study used the open-source SnappyHexMesh tool [48]. Following best meshing practices in [31, 54, 32], this study ensured that the meshes of this study accurately model boundary layer interactions. Each mesh totals 24 million cells, with 500-750k cells dedicated to the car surface, ensuring detailed meshing of the car body and wheels to accurately capture necessary aerodynamic phenomena. For comparison, the largest dataset introduced by [61] after DrivAerNet [22] and DrivAerNet++ had 2474 car designs, and each CFD simulation used approximately 2 million cells. All technical details regarding the meshing process and validation are provided in the appendix.
Automated High-Fidelity CFD Simulation: This study used open-source software OpenFOAM v11 [28] to perform steady-state incompressible simulations using the k-ω SST turbulence model based on Menter's formulation [45]. This study performed quality checks on generated geometries to ensure they were simulation-ready and correctly aligned within the CFD domain, then quality checks on CFD meshing, and finally checks to ensure convergence of each CFD simulation. Overall, this study generated 4,000 additional simulations in the recently released DrivAerNet dataset [22], covering various designs, flow behaviors, turbulence, and separation phenomena.
Computational Cost Running: High-fidelity CFD simulations for DrivAerNet++ require significant computational resources. Simulations were performed on MIT Supercloud, parallelized across 60 nodes, totaling 2880 CPU cores, with each CFD case using 256 cores and 1000 GB of memory. The entire dataset requires 39TB of storage space, with a total of 834,332 files for CFD simulations. Job parallelization was managed using MPI [19], ensuring efficient distribution of computational tasks. Simulations consumed approximately 3 × 10⁶ CPU hours.
Dataset Structure: The dataset representation of this study uses car designs in multiple modalities to ensure comprehensive coverage and ease of use in various applications.
-
3D Car Design: This study provides 3D STL meshes ideal for engineering design, CFD analysis, design optimization, and generative AI applications.
-
ANSA / 3D Parametric Model: Provided to enable researchers to generate their own datasets and incorporate custom parameters as needed for specific research goals.
-
Tabular Parametric Data: Each 3D car geometry parameterization has 26 parameters that completely describe the design. This data can be used for parametric regression, classification, and design feature importance analysis.
-
Aerodynamic Performance Data: Includes force coefficients such as drag \(C_d\), lift (total \(C_l\), rear \(C_{l,r}\), front \(C_{l,f}\)), and moment \(C_m\) values, including mean and standard deviation.
-
CFD Data: Includes raw and post-processed data containing 3D full flow field information for velocity and pressure, surface fields for pressure and wall shear stress, streamlines around the car body, and 2D slices.
-
Point Clouds: Representations of the car surface uniformly sampled at 5k, 10k, 100k, 250k, and 500k nodes.
-
Annotation Labels: Car design and segmentation for different car parts for each car, suitable for tasks such as object detection, semantic segmentation, parametric studies, and automated CFD meshing.
Figure 4 shows a comparative analysis of aerodynamic performance across different design configurations and categories, highlighting the diversity and scale of the dataset of this study.
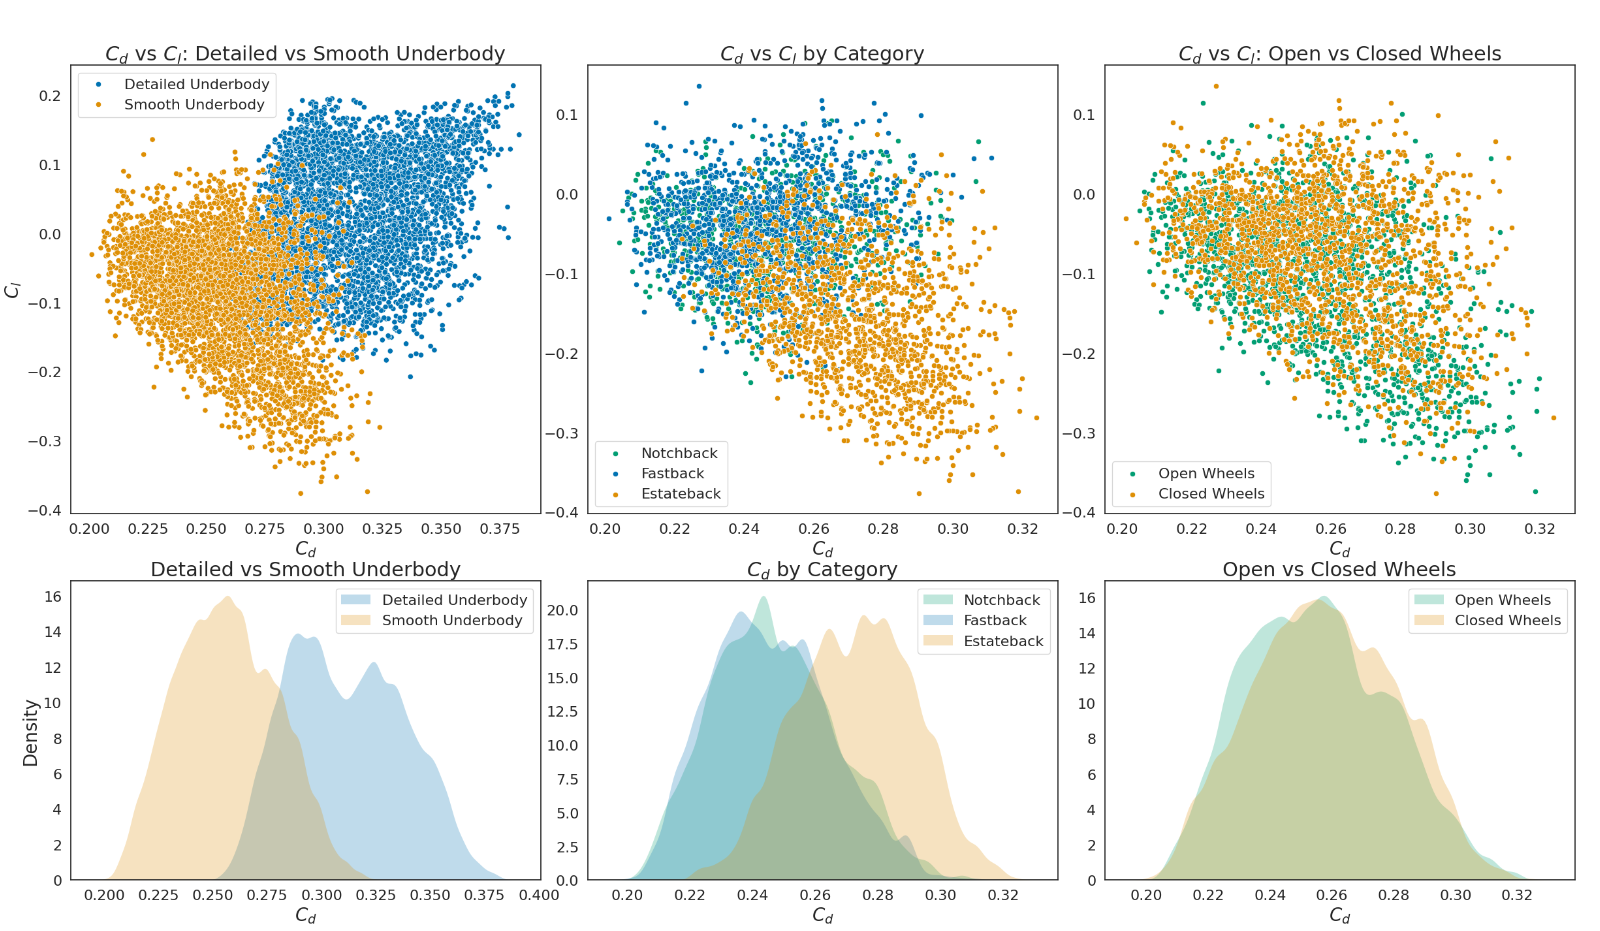
Figure 4: Scatter plots in the top row show the relationship between \(C_d\) and \(C_l\) for different configurations: the first plot shows the effect of chassis configuration, comparing detailed and smooth chassis commonly used in electric vehicles. The second plot highlights the impact of design aesthetics and style across car categories (estateback, fastback, and notchback). The third plot examines the impact of different wheel configurations, emphasizing the importance of minor geometric modifications on aerodynamics. The density plots below show the distribution of \(C_d\) under the same configurations, providing a detailed view of how these design elements and categories affect aerodynamic efficiency.
This study uses the Croissant format [3] to provide detailed metadata for the DrivAerNet++ dataset to ensure comprehensive documentation and ease of use for the research community. This study also includes a datasheet [27] for the dataset, which is provided under a Creative Commons Attribution NonCommercial (CC BY-NC) license. DrivAerNet++ will be hosted on the Harvard Dataverse repository to ensure optimal accessibility and systematic data management. As 39TB of data can pose challenges for data sharing and access, this study also provides subsets of the dataset tailored for different tasks, containing detailed metadata to facilitate usability.
2.2 Benchmark Setup¶
In this paper, this study explores various machine learning tasks, with a particular focus on surrogate modeling (regression) of aerodynamic drag (\(C_d\)). This study distinguishes itself as the first to test diverse models using a large-scale, diverse, and high-fidelity dataset. While previous studies [22, 37, 43, 6, 67, 68] typically limit comparison to a single car design or category, the method of this study enables fair and generalized comparison between models by using a comprehensive and public dataset, demonstrating practical application and performance in automotive aerodynamics.
Metrics and Visualization: This study uses several metrics to evaluate the performance of different models: Mean Squared Error (MSE) quantifies the average squared difference between predicted and actual values, making it sensitive to larger errors. Mean Absolute Error (MAE) measures the average magnitude of errors, less affected by outliers. Maximum Absolute Error (Max AE) identifies the largest prediction error, indicating worst-case accuracy. Coefficient of Determination (R2 Score) indicates the proportion of variance explained by the model, with a value of 1 indicating a perfect fit. Lower MSE and MAE values, and higher \(R^2\) scores and lower Max AE, indicate more accurate predictions. For \(C_d\) estimation, an MAE of less than 0.005 compared to wind tunnel measurements is considered acceptable [59, 37].
DrivAerNet++ provides a multimodal dataset for automotive aerodynamic performance prediction, with the task objective of predicting the car's aerodynamic drag coefficient (\(C_d\)) based on input data.
Input¶
Input data includes the following multimodal information:
- Point Cloud Data: 3D geometric surface representation of car shape, denoted as: \(x \in \mathbb{R}^{N \times 3},\) where \(N\) is the number of point cloud vertices, and each point \(x_i = (x_i, y_i, z_i)\) represents the 3D coordinates of a vertex.
- Design Parameters: Vector representation of parametric car design, denoted as: \(\mathbf{p} \in \mathbb{R}^d,\) where: - \(d\) is the number of design parameters (e.g., 26-50 parameters), used to describe features such as body type, chassis configuration, tire design, etc.
- Additional Flow Field Data (Optional): - Surface pressure field: \(\mathbf{p_s}(x)\). - Surface velocity field: \(\mathbf{u}(x) = (u, v, w)\). Not part of this case, this case only involves aerodynamic drag coefficient (\(C_d\)) prediction.
Task Objective¶
The goal is to build a deep learning model \(f(\cdot)\) that inputs point cloud data \(x\) and predicts the car's aerodynamic drag coefficient \(C_d\), i.e.:
Where: - \(\hat{C}_d\) is the aerodynamic drag coefficient predicted by the model. - \(C_d\) is the true aerodynamic drag coefficient. The model needs to learn the correlation of geometric information of point clouds to accurately predict the drag coefficient.
Evaluation Metrics¶
Model performance is evaluated using the following metrics:
- Mean Squared Error (MSE):
Where: - \(m\) is the number of test samples. - \(C_d^{(i)}\) is the true drag coefficient. - \(\hat{C}_d^{(i)}\) is the drag coefficient predicted by the model.
- Mean Absolute Error (MAE):
- Maximum Absolute Error (Max AE):
This metric measures the worst prediction performance of the model across all test samples.
- Coefficient of Determination (\(R^2\) Score):
Where \(\bar{C}_d\) is the mean of true drag coefficients.
Task Summary: The task objective of DrivAerNet++ is to predict automotive aerodynamic performance through multimodal inputs (point cloud data, or design parameters), with the core evaluation metric being the prediction error of \(C_d\). The model can be used to quickly assess automotive design performance and optimize aerodynamic behavior.
3. Problem Solving¶
3.1 Surrogate Model for Aerodynamic Drag¶
In the conceptual and initial phases of automotive design, the aerodynamic drag coefficient is a key metric as it indicates design efficiency and affects range. Therefore, accurate and rapid drag estimation is crucial in the design process. In this section, this study introduces two methods for aerodynamic drag prediction: first, 3D geometric deep learning using 3D meshes, and second, automated machine learning based on parametric datasets.
3.1.1 Aerodynamic Drag Prediction for 3D Meshes Based on Geometric Deep Learning¶
To predict the aerodynamic drag coefficient (\(C_d\)) of cars, this study adopts a regression method based on deep learning, using two point cloud processing models RegDGCNN and RegPointNet to extract geometric features from input data and complete the regression task respectively. These models can efficiently process 3D point cloud data and combine design parameters to build an end-to-end prediction framework.
- RegDGCNN
RegDGCNN (Dynamic Graph Convolutional Neural Network for Regression) is a dynamic graph convolutional network capable of capturing local and global geometric features of point cloud data. Specifically includes the following core steps:
Dynamic Graph Construction: Dynamically construct the local graph structure of the point cloud via K-Nearest Neighbors algorithm (KNN).
Graph Convolution Operation: Use EdgeConv to convolve features of local neighborhoods to extract local relationships.
Global Feature Integration: Aggregate local features into global features through pooling operations to describe geometric attributes of the entire car.
Output Regression: Input global features into the regression head to predict aerodynamic drag coefficient \(C_d\). The advantage of the model is the ability to efficient capture local geometric relationships of point clouds and combine global context features, suitable for processing complex 3D shapes.
- RegPointNet
RegPointNet is a classic point cloud processing network that learns directly on coordinates of 3D points without explicitly constructing neighborhoods. Specifically includes the following steps:
Local Feature Extraction: Extract features for each point through shared Multi-Layer Perceptron (MLP).
Global Feature Aggregation: Integrate features of all points into global features using symmetric functions (such as max pooling).
Output Regression: Global features are mapped to aerodynamic drag coefficient \(C_d\) through fully connected layers. The advantage of the model is simple structure and fewer parameters, capable of efficiently processing smaller scale point cloud data.
Here, this study tested different geometric deep learning models (PointNet, GCNN, RegDGCNN) implemented in PyTorch [49] and PyTorch Geometric [25] for surrogate modeling tasks of aerodynamic drag, highlighting the importance of dataset diversity and scaling. Specifically, this study trained models using different representations, including graph-based models and point cloud-based models. Unlike previous studies [37, 20, 43, 6], models were trained on one car design (fastback) and in another experiment on all designs (fastback, notchback, and estateback). First, this study trained deep learning models on the DrivAerNet dataset [22], which includes variants of fastbacks with detailed underbodies, open wheels, and mirrors. The dataset contains 4,000 car designs (2800 for training, approx. 600 for validation, 600 for testing), results shown in Table 2. Then, the same models were trained and tested on the DrivAerNet++ dataset, which contains 8,000 widely varying car designs (fastback, notchback, estateback, smooth detailed underbodies, different wheel configurations), split into 5,600 for training, 1,200 for validation, and 1,200 for testing, results shown in Table 3.
| Model | MSE (\(×10^{-5}\)) | MAE (\(×10^{-3}\)) | Max AE (\(×10^{-3}\)) | \(R^2\) | Training Time | Inference Time | Number of Parameters |
|---|---|---|---|---|---|---|---|
| PointNet [53] | 12.0 | 8.85 | 10.18 | 0.826 | 0.5hrs | 0.51s | 2,348,097 |
| GCNN [44] | 10.7 | 7.17 | 10.97 | 0.874 | 10.4hrs | 20.71s | 100,481 |
| RegDGCNN [22] | 8.01 | 6.91 | 8.80 | 0.901 | 3.2hrs | 0.52s | 3,164,257 |
Table 2: Comparative analysis of deep learning models for aerodynamic drag prediction on the test set of the DrivAerNet [22] dataset containing 600 car designs (fastback design with open wheels, mirrors, and detailed chassis structure).
| Model | MSE (\(×10^{-5}\)) | MAE (\(×10^{-3}\)) | Max AE (\(×10^{-3}\)) | \(R^2\) | Training Time | Inference Time | Number of Parameters |
|---|---|---|---|---|---|---|---|
| PointNet [53] | 14.9 | 9.60 | 12.45 | 0.643 | 2.06hrs | 0.84s | 2,348,097 |
| GCNN [42] | 17.1 | 10.43 | 15.03 | 0.596 | 49hrs | 50.8s | 100,481 |
| RegDGCNN [22] | 14.2 | 9.31 | 12.79 | 0.641 | 12.6hrs | 0.85s | 3,164,257 |
Table 3: Comparative analysis of deep learning models for aerodynamic drag prediction on the test set of DrivAerNet++ (All car) containing 1200 car designs.
Shape variations in DrivAerNet++ (see Figure 4) introduce additional challenges. For example, replacing a detailed underbody with a smooth underbody can change the drag distribution of the same car design. Changing wheels from open to closed can slightly affect drag force. Furthermore, different rear configurations lead to different flow separation behaviors, causing significant changes in drag values. These factors make DrivAerNet++ a very challenging task for generalization, as seemingly minor changes significantly affect drag values and pose difficulties for deep learning models to accurately learn features of these changes.
3.1.2 Aerodynamic Drag Prediction Based on Tabular Parametric Data¶
This study also explored the task of using parametric data for aerodynamic drag prediction. For this purpose, this study employs Bayesian hyperparameter tuned Auto ML (Automated Machine Learning) framework [24], as well as models such as Gradient Boosting [26], XGBoost [12], LightGBM [40], Random Forests [10], etc. These methods utilize design parameters to estimate aerodynamic drag without needing detailed 3D geometry. This approach is valuable for efficiently assessing the impact of geometric modifications on drag and overall car performance. Compared to 3D mesh modifications, the use of parametric data offers significant advantages due to its accessibility and ease of manipulation. Engineers can quickly adjust design parameters and immediately observe the impact on aerodynamic performance, thereby streamlining the design process.
This study trained models on a single parametric car design (fastback) and in another experiment on all parametric models (fastback, notchback, and estateback) to explore model generalization across different designs. For both experiments, this study split the dataset into 80% for training and 20% for testing. Then, this study further subsetted the training set by 20%, 40%, 60%, 80%, and 100% of the training portion.
To standardize parametric studies, this study focuses on 26 parameters instead of 50, as the 50 geometric parameter model of DrivAerNet [22] is based only on one car category, specifically the fastback with detailed underbody and open wheels. Results are shown in Figure 5, AutoGluon performs better on the single fastback category, while LightGBM performs better on the combined dataset. Nevertheless, performance of all models drops on the combined dataset. A significant finding is that for all models, whether single category or combined categories, expanding dataset size brings performance improvements. For example, by increasing training set size from 640 to 3200, XGBoost's R2 value increases from approximately 0.35 to 0.55.
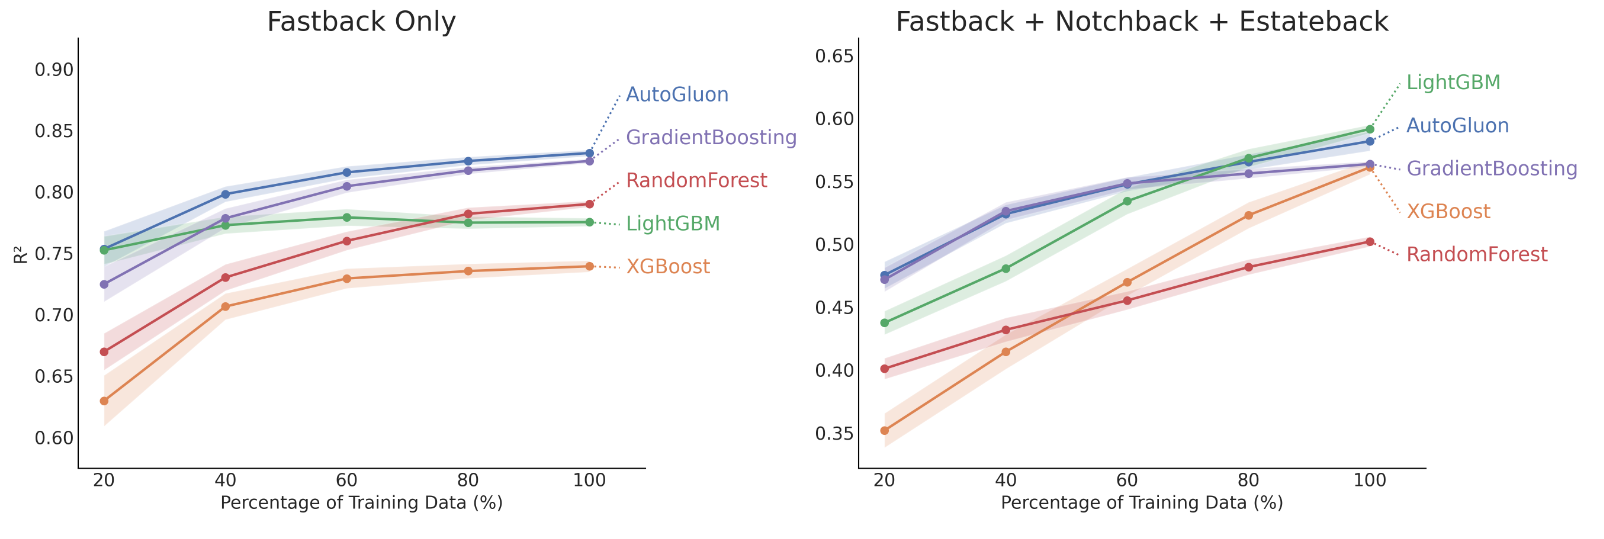
Figure 5: Drag coefficient prediction for different car models based on parametric data. The figure shows the median R2 score and 95% confidence interval as a function of percentage of training data.
1. Data Augmentation Class: DataAugmentation:
Used for random transformation of point clouds, including translation, adding noise, and random dropping of points, to improve the generalization ability of the model.
2. Dataset Class: DrivAerNetPlusPlusDataset:
Used to load the DrivAerNetPlusPlus dataset and process point cloud data (such as sampling, augmentation, and normalization).
109 110 111 112 113 114 115 116 117 118 119 120 121 122 123 124 125 126 127 128 129 130 131 132 133 134 135 136 137 138 139 140 141 142 143 144 145 146 147 148 149 150 151 152 153 154 155 156 157 158 159 160 161 162 163 164 165 166 167 168 169 170 171 172 173 174 175 176 177 178 179 180 181 182 183 184 185 186 187 188 189 190 191 192 193 194 195 196 197 198 199 200 201 202 203 204 205 206 207 208 209 210 211 212 213 214 215 216 217 218 219 220 221 222 223 224 225 226 227 228 229 230 231 232 233 234 235 236 237 238 239 240 241 242 243 244 245 246 247 248 249 250 251 252 253 254 255 256 257 258 259 260 261 262 263 264 265 266 267 268 269 270 271 272 273 274 275 276 277 278 279 280 281 282 283 284 285 286 287 288 289 290 291 292 293 294 295 296 297 298 299 300 301 302 303 304 305 306 307 308 309 310 311 312 313 314 315 316 317 318 319 320 321 322 323 324 | |
3.2 Model Selection¶
In this problem, two models (RegDGCNN and PointNet) are used to learn on the DrivAerNet dataset to predict the aerodynamic drag coefficient (\(C_d\)) of input point clouds. These two models differ in feature extraction methods and network architecture design, specifically as follows:
Output: Predicted aerodynamic drag coefficient (\(C_d\)), as the regression output of the model.
| Feature | RegDGCNN | PointNet |
|---|---|---|
| Feature Learning Method | Dynamically construct graph structure, capture local geometric relationships | No need to construct graph structure, learn vertex features directly |
| Local Feature Extraction | Use EdgeConv to aggregate neighborhood features | Use shared MLP to encode single points |
| Global Feature Aggregation | Dynamic graph feature pooling | Max pooling |
| Applicable Scenarios | Tasks with complex geometric shapes and significant local point cloud relationships | Tasks with uniform point cloud distribution or fewer points |
    model = ppsci.arch.RegPointNet(
        input_keys=cfg.MODEL.input_keys,
        output_keys=cfg.MODEL.output_keys,
        weight_keys=cfg.MODEL.weight_keys,
        args=cfg.MODEL)  # Select model according to your needs, RegDGCNN can refer to DrivAerNet settings.
Model parameters are as follows:
MODEL:
  input_keys: ["vertices"] # Keyword for input data (3D vertex data)
  output_keys: ["cd_value"] # Keyword for output data (aerodynamic drag coefficient C_d)
  weight_keys: ["weight_keys"] # Keyword for weight data (for weighted loss functions, etc.)
  dropout: 0.0 # Dropout rate, prevents overfitting; set to 0.0 here to not use Dropout
  emb_dims: 1024 # Dimension of feature embedding, controls global feature representation capability
  channels: [6, 64, 128, 256, 512, 1024] # Number of feature channels, feature dimension extracted at each layer; usually increases from low to high
  linear_sizes: [128, 64, 32, 16] # Sizes of fully connected layers, representing number of neurons per layer in regression head
  k: 40 # K nearest neighbors, representing number of neighbor points when building dynamic graph
  output_channels: 1 # Number of model output channels, 1 here, representing a single output value (aerodynamic drag coefficient C_d)
3.3 Constraint Construction¶
3.3.1 Supervised Constraint¶
Since we train in a supervised learning manner, we use supervised constraint SupervisedConstraint here:
3.4 Optimizer Construction¶
The optimizer is a key part of model training, used to adjust model parameters via gradient descent (or other algorithms). In this scenario, Adam and SGD optimizers are used, and the learning rate is dynamically adjusted through a learning rate scheduler.
3.5 Validator Construction¶
Usually during the training process, the training status of the current model is evaluated using the validation set (test set) at a certain epoch interval, so ppsci.validate.SupervisedValidator is used to construct the validator.
Evaluation metric metric selects ppsci.metric.MSE, or other evaluation metrics can be selected according to needs.
3.6 Model Training and Evaluation¶
After completing the above settings, pass the instantiated objects to ppsci.solver.Solver, and then start training and evaluation.
4. Complete Code¶
16 17 18 19 20 21 22 23 24 25 26 27 28 29 30 31 32 33 34 35 36 37 38 39 40 41 42 43 44 45 46 47 48 49 50 51 52 53 54 55 56 57 58 59 60 61 62 63 64 65 66 67 68 69 70 71 72 73 74 75 76 77 78 79 80 81 82 83 84 85 86 87 88 89 90 91 92 93 94 95 96 97 98 99 100 101 102 103 104 105 106 107 108 109 110 111 112 113 114 115 116 117 118 119 120 121 122 123 124 125 126 127 128 129 130 131 132 133 134 135 136 137 138 139 140 141 142 143 144 145 146 147 148 149 150 151 152 153 154 155 156 157 158 159 160 161 162 163 164 165 166 167 168 169 170 171 172 173 174 175 176 177 178 179 180 181 182 183 184 185 186 187 188 189 190 191 192 193 194 195 196 197 198 199 | |
5. Result Display¶
5.1 Limitations and Future Work¶
The DrivAerNet++ dataset contains 8000 car designs, covering most conventional car designs. However, simulation fidelity is slightly lower than typically used in industry (CFD meshes of O(100M) cells [4]). Additionally, errors are introduced when using steady-state RANS simulations for highly turbulent and time-varying flows around 3D cars. While the k-ω-SST model [45] provides accurate results, it struggles to predict flow separation and reattachment [36, 4]. Future work should employ hybrid RANS-LES methods to better capture time-dependence of flow fields.
Furthermore, the surrogate models trained in this study are not complex enough to learn intricate geometric and aerodynamic features. More advanced models, such as Geometry-Informed Neural Operator [43], Convolutional Occupancy Networks [51], and sophisticated graph models, should be tested. This study primarily focused on drag surrogate modeling as it is the most critical factor in initial design stages. However, leveraging DrivAerNet++ for other tasks such as accelerating CFD simulations is necessary for a more comprehensive approach.
To enhance the dataset, future work will focus on integrating transient CFD simulations and incorporating additional modalities such as 2D image rendering and multimodal learning methods. This will improve model accuracy and robustness, driving innovation in automotive design and optimization.
5.2 Conclusion and PaddlePaddle Version Results¶
In this paper, this study introduces DrivAerNet++, the largest multimodal 3D dataset for data-driven aerodynamic design, containing high-fidelity CFD simulations and diverse car designs. The dataset of this study includes 8000 cars based on industry-standard shapes, providing broad coverage of various aerodynamic performance metrics. The dataset requires 39TB of storage, significantly larger than comparable engineering datasets, and is publicly available. Furthermore, the computational cost of generating DrivAerNet++ is an order of magnitude larger than a recently published CFD dataset [43], which used 185,744 CPU hours, while the dataset of this study required 3 million CPU hours.
The dataset supports a wide range of machine learning tasks, including aerodynamic performance surrogate modeling, acceleration of CFD simulations, data-driven design optimization, generative AI, shape and part classification, and 3D shape reconstruction. This study also presents first benchmarking results demonstrating the effectiveness of geometric deep learning models and AutoML frameworks for drag coefficient prediction. Additionally, this study explored challenges in building generalized models for drag force surrogate modeling across different types of cars. While models trained on single car categories perform well, their performance significantly drops from 0.82 - 0.9 to 0.6 in terms of R2 when applied to fully diverse datasets. This highlights the complexity of achieving robust performance across diverse designs. The dataset of this study can be used for data-driven design of Internal Combustion Engine (ICE) and Electric Vehicles, covering major design aspects such as aesthetics/styling, aerodynamic efficiency, and performance. This study believes this dataset will serve as a cornerstone for advancing engineering design and CFD research, providing rich resources for developing more accurate and efficient predictive models.
Experimental results are shown below:
| Model | \(MSE (10^{-5})\) | \(MAE (10^{-3})\) | \(Max\) \(AE (10^{-3})\) | \(R^2\) | Remarks |
|---|---|---|---|---|---|
| RegPointNet | 11.2 | 8.10 | 14.9 | 0.9201 | BS16 |
6. Reference¶
Reference Code: https://github.com/Mohamedelrefaie/DrivAerNet/tree/main/DeepSurrogates
Reference List
[1] Asad Abbas, Ashkan Rafiee, Max Haase, and Andrew Malcolm. Geometrical deep learning for performance prediction of high-speed craft. Ocean Engineering, 258:111716, 2022.
[2] S. R. Ahmed, G. Ramm, and G. Faltin. Some salient features of the time -averaged ground vehicle wake. SAE Transactions, 93:473–503, 1984. ISSN 0096736X. URL http://www.jstor.org/stable/ 44434262.
[3] Mubashara Akhtar, Omar Benjelloun, Costanza Conforti, Pieter Gijsbers, Joan Giner-Miguelez, Nitisha Jain, Michael Kuchnik, Quentin Lhoest, Pierre Marcenac, Manil Maskey, Peter Mattson, Luis Oala, Pierre Ruyssen, Rajat Shinde, Elena Simperl, Goeffry Thomas, Slava Tykhonov, Joaquin Vanschoren, Jos van der Velde, Steffen Vogler, and Carole-Jean Wu. Croissant: A metadata format for ml-ready datasets. DEEM ’24, page 1–6, New York, NY, USA, 2024. Association for Computing Machinery. ISBN 9798400706110. doi: 10.1145/3650203.3663326. URL https://doi.org/10.1145/3650203.3663326.
[4] Neil Ashton, A West, S Lardeau, and Alistair Revell. Assessment of rans and des methods for realistic automotive models. Computers & fluids, 128:1–15, 2016.
[5] Neil Ashton, Paul Batten, Andrew Cary, and Kevin Holst. Summary of the 4th high-lift prediction workshop hybrid rans/les technology focus group. Journal of Aircraft, pages 1–30, 2023.
[6] Pierre Baque, Edoardo Remelli, Francois Fleuret, and Pascal Fua. Geodesic convolutional shape optimization. In Jennifer Dy and Andreas Krause, editors, Proceedings of the 35th International Conference on Machine Learning, volume 80 of Proceedings of Machine Learning Research, pages 472–481. PMLR, 10–15 Jul 2018. URL https://proceedings.mlr.press/v80/baque18a.html.
[7] Florent Bonnet, Jocelyn Mazari, Paola Cinnella, and Patrick Gallinari. Airfrans: High fidelity computational fluid dynamics dataset for approximating reynolds-averaged navier–stokes solutions. Advances in Neural Information Processing Systems, 35:23463–23478, 2022.
[8] Christian Brand, Jillian Anable, Ioanna Ketsopoulou, and Jim Watson. Road to zero or road to nowhere? disrupting transport and energy in a zero carbon world. Energy Policy, 139:111334, 2020.
[9] Adam Brandt, Henrik Berg, Michael Bolzon, and Linda Josefsson. The effects of wheel design on the aerodynamic drag of passenger vehicles. SAE International Journal of Advances and Current Practices in Mobility, 1(2019-01-0662):1279–1299, 2019.
[10] Leo Breiman. Random forests. Machine learning, 45:5–32, 2001.
[11] Angel X Chang, Thomas Funkhouser, Leonidas Guibas, Pat Hanrahan, Qixing Huang, Zimo Li, Silvio Savarese, Manolis Savva, Shuran Song, Hao Su, et al. Shapenet: An information-rich 3d model repository. arXiv preprint arXiv:1512.03012, 2015.
[12] Tianqi Chen and Carlos Guestrin. Xgboost: A scalable tree boosting system. In Proceedings of the 22nd acm sigkdd international conference on knowledge discovery and data mining, pages 785–794, 2016.
[13] Wai Tong Chung, Bassem Akoush, Pushan Sharma, Alex Tamkin, Ki Sung Jung, Jacqueline Chen, Jack Guo, Davy Brouzet, Mohsen Talei, Bruno Savard, et al. Turbulence in focus: Benchmarking scaling behavior of 3d volumetric super-resolution with blastnet 2.0 data. Advances in Neural Information Processing Systems, 36, 2024.
[14] Adam Cobb, Anirban Roy, Daniel Elenius, Frederick Heim, Brian Swenson, Sydney Whittington, James Walker, Theodore Bapty, Joseph Hite, Karthik Ramani, et al. Aircraftverse: A large-scale multimodal dataset of aerial vehicle designs. Advances in Neural Information Processing Systems, 36:44524–44543, 2023.
[15] Blender Online Community. Blender - a 3D modelling and rendering package. Blender Foundation, Stichting Blender Foundation, Amsterdam, 2018. URL http://www.blender.org.
[16] Angela Dai, Angel X Chang, Manolis Savva, Maciej Halber, Thomas Funkhouser, and Matthias Nießner. Scannet: Richly-annotated 3d reconstructions of indoor scenes. In Proceedings of the IEEE conference on computer vision and pattern recognition, pages 5828–5839, 2017.
[17] Guillaume Damblin, Mathieu Couplet, and Bertrand Iooss. Numerical studies of space-filling designs: optimization of latin hypercube samples and subprojection properties. Journal of Simulation, 7(4):276–289, 2013.
[18] Jia Deng, Wei Dong, Richard Socher, Li-Jia Li, Kai Li, and Li Fei-Fei. Imagenet: A large-scale hierarchical image database. In 2009 IEEE conference on computer vision and pattern recognition, pages 248–255. Ieee, 2009.
[19] Open MPI Documentation. mpirun / mpiexec, 2024. URL https://docs.open-mpi.org/en/v5.0.x/ man-openmpi/man1/mpirun.1.html. Accessed: 2024-05-26.
[20] Benet Eiximeno, Arnau Miró, Ivette Rodríguez, and Oriol Lehmkuhl. Toward the usage of deep learning surrogate models in ground vehicle aerodynamics. Mathematics, 12(7):998, 2024.
[21] Mohamed Elrefaie, Tarek Ayman, Mayar A Elrefaie, Eman Sayed, Mahmoud Ayyad, and Mohamed M AbdelRahman. Surrogate modeling of the aerodynamic performance for airfoils in transonic regime. In AIAA SCITECH 2024 Forum, page 2220, 2024.
[22] Mohamed Elrefaie, Angela Dai, and Faez Ahmed. Drivaernet: A parametric car dataset for data-driven aerodynamic design and graph-based drag prediction. arXiv preprint arXiv:2403.08055, 2024.
[23] Mohamed Elrefaie, Steffen Hüttig, Mariia Gladkova, Timo Gericke, Daniel Cremers, and Christian Breitsamter. Real-time and on-site aerodynamics using stereoscopic piv and deep optical flow learning. arXiv preprint arXiv:2401.09932, 2024.
[24] Nick Erickson, Jonas Mueller, Alexander Shirkov, Hang Zhang, Pedro Larroy, Mu Li, and Alexander Smola. Autogluon-tabular: Robust and accurate automl for structured data. arXiv preprint arXiv:2003.06505, 2020.
[25] Matthias Fey and Jan Eric Lenssen. Fast graph representation learning with pytorch geometric. arXiv preprint arXiv:1903.02428, 2019.
[26] Jerome H Friedman. Greedy function approximation: a gradient boosting machine. Annals of statistics, pages 1189–1232, 2001.
[27] Timnit Gebru, Jamie Morgenstern, Briana Vecchione, Jennifer Wortman Vaughan, Hanna Wallach, Hal Daumé Iii, and Kate Crawford. Datasheets for datasets. Communications of the ACM, 64(12): 86–92, 2021.
[28] Christopher Greenshields. OpenFOAM v11 User Guide. The OpenFOAM Foundation, London, UK, 2023. URL https://doc.cfd.direct/openfoam/user-guide-v11.
[29] Erkan Gunpinar, Umut Can Coskun, Mustafa Ozsipahi, and Serkan Gunpinar. A generative design and drag coefficient prediction system for sedan car side silhouettes based on computational fluid dynamics. CAD Computer Aided Design, 111:65–79, 6 2019. ISSN 00104485. doi: 10.1016/j.cad.2019.02.003.
[30] Sheikh Md Shakeel Hassan, Arthur Feeney, Akash Dhruv, Jihoon Kim, Youngjoon Suh, Jaiyoung Ryu, Yoonjin Won, and Aparna Chandramowlishwaran. Bubbleml: A multiphase multiphysics dataset and benchmarks for machine learning. Advances in Neural Information Processing Systems, 36, 2024.
[31] Angelina Heft, Thomas Indinger, and Nikolaus Adams. Investigation of unsteady flow structures in the wake of a realistic generic car model. In 29th AIAA applied aerodynamics conference, page 3669, 2011.
[32] Angelina I Heft, Thomas Indinger, and Nikolaus A Adams. Experimental and numerical investigation of the drivaer model. In Fluids Engineering Division Summer Meeting, volume 44755, pages 41–51. American Society of Mechanical Engineers, 2012.
[33] Angelina I Heft, Thomas Indinger, and Nikolaus A Adams. Introduction of a new realistic generic car model for aerodynamic investigations. Technical report, SAE Technical Paper, 2012.
[34] Wolf-Heinrich Hucho. Aerodynamik des Automobils: eine Brücke von der Strömungsmechanik zur Fahrzeugtechnik. Springer-Verlag, 2013.
[35] Sergey Ioffe and Christian Szegedy. Batch normalization: Accelerating deep network training by reducing internal covariate shift. In International conference on machine learning, pages 448–456. pmlr, 2015.
[36] M Islam, F Decker, E De Villiers, Aea Jackson, J Gines, T Grahs, A Gitt-Gehrke, and J Comas i Font. Application of detached-eddy simulation for automotive aerodynamics development. Technical report, SAE Technical Paper, 2009.
[37] Sam Jacob Jacob, Markus Mrosek, Carsten Othmer, and Harald Köstler. Deep learning for real-time aerodynamic evaluations of arbitrary vehicle shapes. SAE International Journal of Passenger Vehicle Systems, 15(2):77–90, mar 2022. ISSN 2770-3460. doi: https://doi.org/10.4271/15-15-02-0006. URL https://doi.org/10.4271/15-15-02-0006.
[38] Max Jaderberg, Karen Simonyan, Andrew Zisserman, et al. Spatial transformer networks. Advances in neural information processing systems, 28, 2015.
[39] Ali Kashefi and Tapan Mukerji. Physics-informed pointnet: A deep learning solver for steady-state incompressible flows and thermal fields on multiple sets of irregular geometries. Journal of Computational Physics, 468:111510, 2022.
[40] Guolin Ke, Qi Meng, Thomas Finley, Taifeng Wang, Wei Chen, Weidong Ma, Qiwei Ye, and Tie-Yan Liu. Lightgbm: A highly efficient gradient boosting decision tree. Advances in neural information processing systems, 30, 2017.
[41] Diederik P Kingma and Jimmy Ba. Adam: A method for stochastic optimization. arXiv preprint arXiv:1412.6980, 2014.
[42] Thomas N Kipf and Max Welling. Semi-supervised classification with graph convolutional networks. arXiv preprint arXiv:1609.02907, 2016.
[43] Zongyi Li, Nikola Borislavov Kovachki, Chris Choy, Boyi Li, Jean Kossaifi, Shourya Prakash Otta, Mohammad Amin Nabian, Maximilian Stadler, Christian Hundt, Kamyar Azizzadenesheli, and Anima Anandkumar. Geometry-informed neural operator for large-scale 3d pdes, 2023.
[44] H Martins, CO Henriques, JR Figueira, CS Silva, and AS Costa. Assessing policy interventions to stimulate the transition of electric vehicle technology in the european union. Socio-Economic Planning Sciences, 87: 101505, 2023.
[45] Florian R Menter, Martin Kuntz, Robin Langtry, et al. Ten years of industrial experience with the sst turbulence model. Turbulence, heat and mass transfer, 4(1):625–632, 2003.
[46] Peter Mock and Sonsoles Díaz. Pathways to decarbonization: the european passenger car market in the years 2021–2035. communications, 49:847129–848102, 2021.
[47] Chair of Aerodynamics and Technical University of Munich Fluid Mechanics. Drivaer model geometry. https://www.epc.ed.tum.de/en/aer/research-groups/automotive/drivaer/ geometry/, 2024. Accessed: 2024-05-21.
[48] OpenFOAM Foundation. Meshing with snappyHexMesh, 2023. URL https://www.openfoam.com/ documentation/guides/latest/doc/guide-meshing-snappyhexmesh.html. Accessed: 2024-0605.
[49] Adam Paszke, Sam Gross, Francisco Massa, Adam Lerer, James Bradbury, Gregory Chanan, Trevor Killeen, Zeming Lin, Natalia Gimelshein, Luca Antiga, et al. Pytorch: An imperative style, high-performance deep learning library. Advances in neural information processing systems, 32, 2019.
[50] Giancarlo Pavia and Martin Passmore. Characterisation of wake bi-stability for a square-back geometry with rotating wheels. In Progress in Vehicle Aerodynamics and Thermal Management: 11th FKFS Conference, Stuttgart, September 26-27, 2017 11, pages 93–109. Springer, 2018.
[51] Songyou Peng, Michael Niemeyer, Lars Mescheder, Marc Pollefeys, and Andreas Geiger. Convolutional occupancy networks. In Computer Vision–ECCV 2020: 16th European Conference, Glasgow, UK, August 23–28, 2020, Proceedings, Part III 16, pages 523–540. Springer, 2020.
[52] Leif E Peterson. K-nearest neighbor. Scholarpedia, 4(2):1883, 2009.
[53] Charles R Qi, Hao Su, Kaichun Mo, and Leonidas J Guibas. Pointnet: Deep learning on point sets for 3d classification and segmentation. In Proceedings of the IEEE conference on computer vision and pattern recognition, pages 652–660, 2017.
[54] Peng Qin, Alessio Ricci, and Bert Blocken. Cfd simulation of aerodynamic forces on the drivaer car model: Impact of computational parameters. Journal of Wind Engineering and Industrial Aerodynamics, 248:105711, 2024. ISSN 0167-6105. doi: https://doi.org/10.1016/j.jweia.2024.105711. URL https: //www.sciencedirect.com/science/article/pii/S0167610524000746.
[55] Edoardo Remelli, Artem Lukoianov, Stephan Richter, Benoit Guillard, Timur Bagautdinov, Pierre Baque, and Pascal Fua. Meshsdf: Differentiable iso-surface extraction. Advances in Neural Information Processing Systems, 33:22468–22478, 2020. URL https://proceedings.neurips.cc/paper_files/paper/ 2020/file/fe40fb944ee700392ed51bfe84dd4e3d-Paper.pdf.
[56] Thiago Rios, Patricia Wollstadt, Bas Van Stein, Thomas Back, Zhao Xu, Bernhard Sendhoff, and Stefan Menzel. Scalability of learning tasks on 3d cae models using point cloud autoencoders. pages 13671374. Institute of Electrical and Electronics Engineers Inc., 12 2019. ISBN 9781728124858. doi: 10.1109/SSCI44817.2019.9002982.
[57] Thiago Rios, Bas Van Stein, Thomas Back, Bernhard Sendhoff, and Stefan Menzel. Point2ffd: Learning shape representations of simulation-ready 3d models for engineering design optimization. pages 10241033. Institute of Electrical and Electronics Engineers Inc., 2021. ISBN 9781665426886. doi: 10.1109/ 3DV53792.2021.00110.
[58] Thiago Rios, Bas van Stein, Patricia Wollstadt, Thomas Bäck, Bernhard Sendhoff, and Stefan Menzel. Exploiting local geometric features in vehicle design optimization with 3d point cloud autoencoders. In 2021 IEEE Congress on Evolutionary Computation (CEC), pages 514–521, 2021. doi: 10.1109/CEC45853. 2021.9504746.
[59] Thomas Schütz. Hucho-Aerodynamik des Automobils: Strömungsmechanik, Wärmetechnik, Fahrdynamik, Komfort. Springer-Verlag, 2013.
[60] Shengrong Shen, Tian Han, and Jiachen Pang. Car drag coefficient prediction using long–short term memory neural network and lasso. Measurement, 225:113982, 2024.
[61] Binyang Song, Chenyang Yuan, Frank Permenter, Nikos Arechiga, and Faez Ahmed. Surrogate modeling of car drag coefficient with depth and normal renderings. arXiv preprint arXiv:2306.06110, 2023.
[62] D Brian Spalding. The numerical computation of turbulent flow. Comp. Methods Appl. Mech. Eng., 3:269, 1974.
[63] Guocheng Tao, Chengwei Fan, Wen Wang, Wenjun Guo, and Jiahuan Cui. Multi-fidelity deep learning for aerodynamic shape optimization using convolutional neural network. Physics of Fluids, 36(5), 2024.
[64] Nils Thuerey, Konstantin Weißenow, Lukas Prantl, and Xiangyu Hu. Deep learning methods for reynoldsaveraged navier–stokes simulations of airfoil flows. AIAA Journal, 58(1):25–36, 2020.
[65] Artur Toshev, Gianluca Galletti, Fabian Fritz, Stefan Adami, and Nikolaus Adams. Lagrangebench: A lagrangian fluid mechanics benchmarking suite. Advances in Neural Information Processing Systems, 36, 2024.
[66] Thanh Luan Trinh, Fangge Chen, Takuya Nanri, and Kei Akasaka. 3d super-resolution model for vehicle flow field enrichment. In Proceedings of the IEEE/CVF Winter Conference on Applications of Computer Vision, pages 5826–5835, 2024.
[67] Nobuyuki Umetani and Bernd Bickel. Learning three-dimensional flow for interactive aerodynamic design. ACM Transactions on Graphics, 37, 2018. ISSN 15577368. doi: 10.1145/3197517.3201325.
[68] Muhammad Usama, Aqib Arif, Farhan Haris, Shahroz Khan, S. Kamran Afaq, and Shahrukh Rashid. A datadriven interactive system for aerodynamic and user-centred generative vehicle design. In 2021 International Conference on Artificial Intelligence (ICAI), pages 119–127, 2021. doi: 10.1109/ICAI52203.2021.9445243.
[69] Laurens Van der Maaten and Geoffrey Hinton. Visualizing data using t-sne. Journal of machine learning research, 9(11), 2008.
[70] Yue Wang, Yongbin Sun, Ziwei Liu, Sanjay E Sarma, Michael M Bronstein, and Justin M Solomon. Dynamic graph cnn for learning on point clouds. ACM Transactions on Graphics (tog), 38(5):1–12, 2019.
[71] Mark D Wilkinson, Michel Dumontier, IJsbrand Jan Aalbersberg, Gabrielle Appleton, Myles Axton, Arie Baak, Niklas Blomberg, Jan-Willem Boiten, Luiz Bonino da Silva Santos, Philip E Bourne, et al. The fair guiding principles for scientific data management and stewardship. Scientific data, 3(1):1–9, 2016.
[72] Zhirong Wu, Shuran Song, Aditya Khosla, Fisher Yu, Linguang Zhang, Xiaoou Tang, and Jianxiong Xiao. 3d shapenets: A deep representation for volumetric shapes. In Proceedings of the IEEE conference on computer vision and pattern recognition, pages 1912–1920, 2015.
[73] Yu Xiang, Wonhui Kim, Wei Chen, Jingwei Ji, Christopher Choy, Hao Su, Roozbeh Mottaghi, Leonidas Guibas, and Silvio Savarese. Objectnet3d: A large scale database for 3d object recognition. In Computer Vision–ECCV 2016: 14th European Conference, Amsterdam, The Netherlands, October 11-14, 2016, Proceedings, Part VIII 14, pages 160–176. Springer, 2016.