NowcastNet
None
# linux
wget -c https://paddle-org.bj.bcebos.com/paddlescience/datasets/nowcastnet/mrms.tar
# windows
# curl https://paddle-org.bj.bcebos.com/paddlescience/datasets/nowcastnet/mrms.tar -o mrms.tar
mkdir ./datasets
tar -xvf mrms.tar -C ./datasets/
python nowcastnet.py mode=eval EVAL.pretrained_model_path=https://paddle-org.bj.bcebos.com/paddlescience/models/nowcastnet/nowcastnet_pretrained.pdparams
1. Background Introduction
Deep learning has recently emerged as a powerful tool for weather forecasting, particularly for precipitation nowcasting using radar data. These methods leverage vast amounts of radar composite observations to train end-to-end neural networks, often without explicit reliance on physical laws.
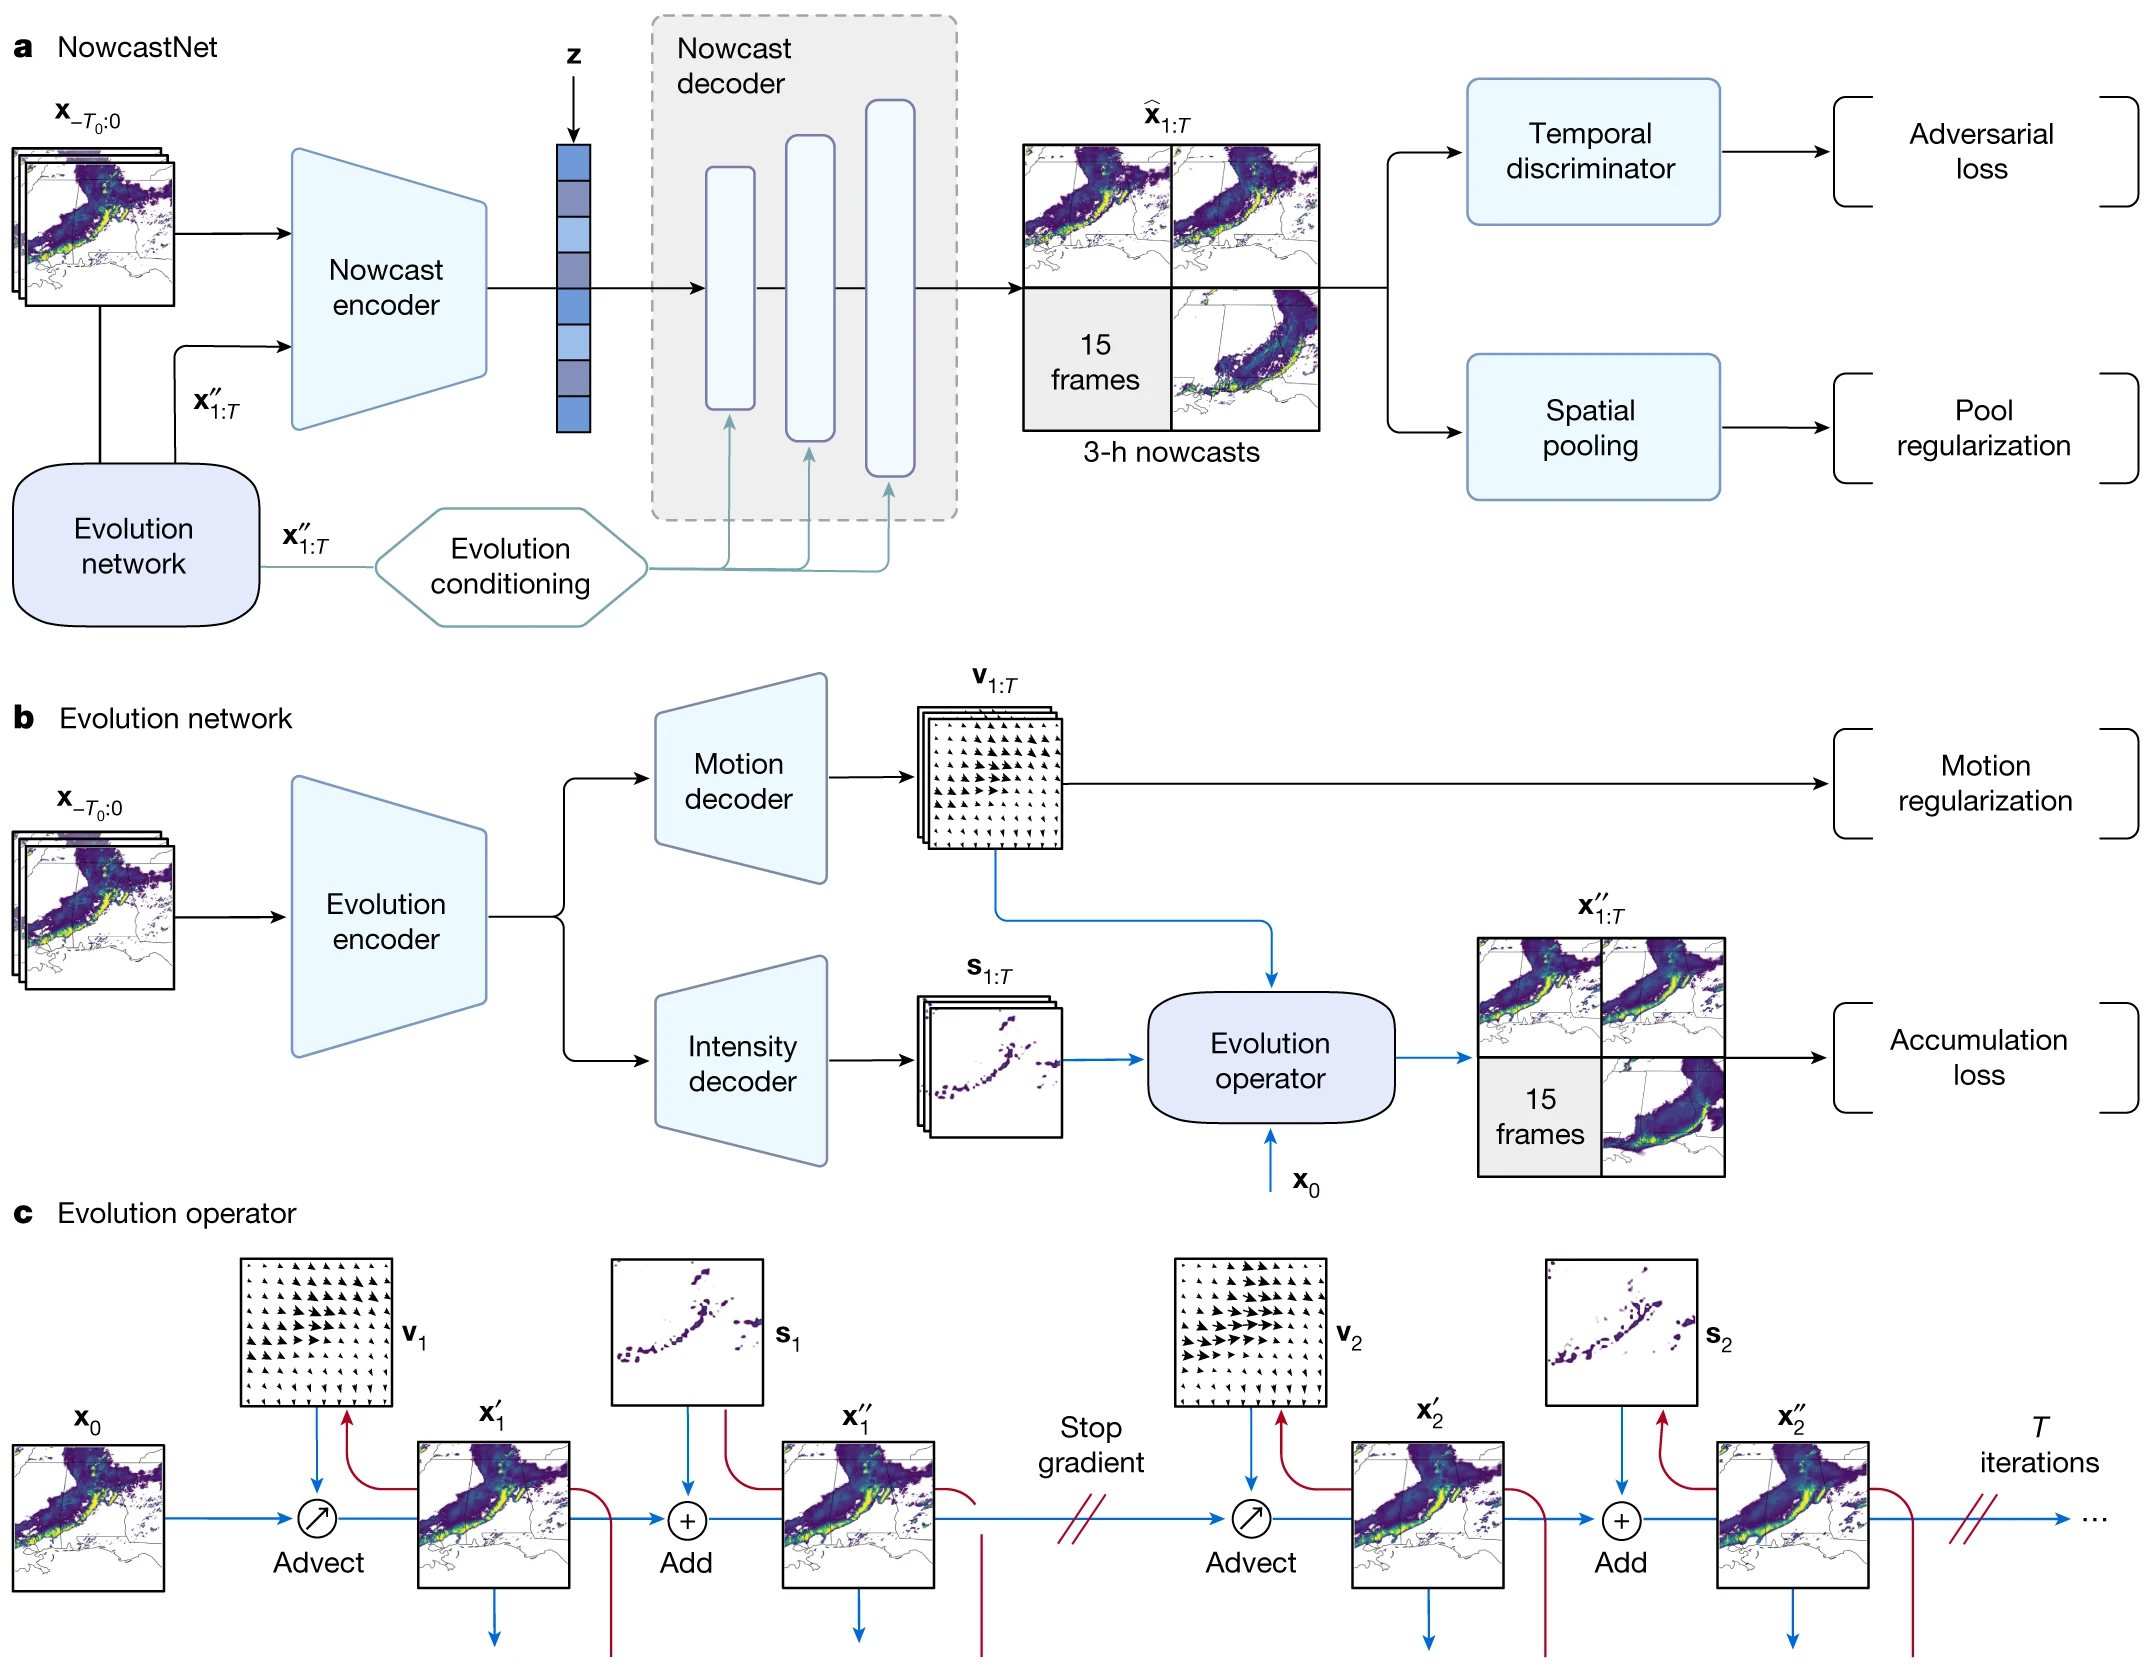
Here, we reproduce NowcastNet, a nonlinear model designed for extreme precipitation nowcasting. NowcastNet unifies physical evolution schemes with conditional learning within a neural network framework, enabling effective end-to-end optimization.
2. Model Principle
This chapter only briefly introduces the model principle of NowcastNet. For detailed theoretical derivation, please read Skilful nowcasting of extreme precipitation with NowcastNet.
The model architecture is illustrated below:
The model utilizes pre-trained weights for inference. We detail the inference process below.
3. Model Construction
The PaddleScience implementation is as follows:
| examples/nowcastnet/conf/nowcastnet.yaml | |
|---|---|
Here, input_keys and output_keys denote the input and output variable names of the network model.
4. Model Evaluation Visualization
After configuration, pass the instantiated objects to ppsci.solver.Solver:
| examples/nowcastnet/nowcastnet.py | |
|---|---|
Next, initialize VisualizerRadar to generate visualization results:
5. Complete Code
| examples/nowcastnet/nowcastnet.py | |
|---|---|
1 2 3 4 5 6 7 8 9 10 11 12 13 14 15 16 17 18 19 20 21 22 23 24 25 26 27 28 29 30 31 32 33 34 35 36 37 38 39 40 41 42 43 44 45 46 47 48 49 50 51 52 53 54 55 56 57 58 59 60 61 62 63 64 65 66 67 68 69 70 71 72 73 74 75 76 77 78 79 80 81 82 83 84 85 86 87 88 89 90 91 92 93 94 95 96 97 98 99 100 101 102 103 104 105 106 107 108 109 110 111 112 113 114 115 116 117 118 119 120 121 122 123 124 125 126 127 128 129 130 131 132 133 134 135 136 137 138 139 140 141 142 143 144 145 146 147 148 149 150 151 152 153 154 155 156 157 158 159 160 161 162 163 164 165 166 167 168 169 170 171 172 173 174 175 176 177 178 179 180 181 182 183 184 185 186 187 188 189 190 191 192 193 194 | |
6. Result Display
The figures below display the model's predictions compared to the ground truth.

