FuXi
None
None
None
cd examples/fuxi
# Download sample input data and model weight from https://pan.baidu.com/s/1PDeb-nwUprYtu9AKGnWnNw?pwd=fuxi#list/path=%2F
unzip Sample_Data.zip
unzip FuXi_EC.zip

# modify the path of model and datasets in examples/fuxi/conf, and inference
pip install -r requirements.txt
python predict.py
1. Background Introduction
The FuXi model is a machine learning (ML) weather forecasting system designed to generate 15-day global weather forecasts. It utilizes 39 years of ECMWF ERA5 reanalysis data with 0.25° spatial resolution and 6-hour temporal resolution. The FuXi system is named after Fu Xi, a figure in ancient Chinese mythology who is considered the first weather forecaster in China.
Key aspects and background of FuXi model development include:
-
Motivation: The development of FuXi was motivated by the limitations of current ML models in long-term weather forecasting due to error accumulation. Although ML models have shown promise in short-term forecasting, achieving performance comparable to ECMWF's traditional numerical weather prediction (NWP) models in long-term forecasting (e.g., 15 days) remains a challenge.
-
Cascade Model Architecture: To address the problem of error accumulation, FuXi adopts a novel Cascade ML model architecture. This architecture uses pre-trained models optimized for specific 5-day forecast time windows (0-5 days, 5-10 days, and 10-15 days) to improve the accuracy of different forecast lead times.
-
Base Model: The base model of FuXi is an autoregressive model designed to extract complex features and learn relationships from high-dimensional weather data.
-
Training Process: The training process of FuXi includes two steps: pre-training and fine-tuning. The pre-training step optimizes the model to predict a single time step, while fine-tuning involves training the Cascade models for their respective forecast time windows.
-
Performance: The FuXi system demonstrates performance comparable to the ECMWF Ensemble Mean (EM) in 15-day forecasts and outperforms the ECMWF High-Resolution Forecast (HRES) in terms of effective forecast lead time.
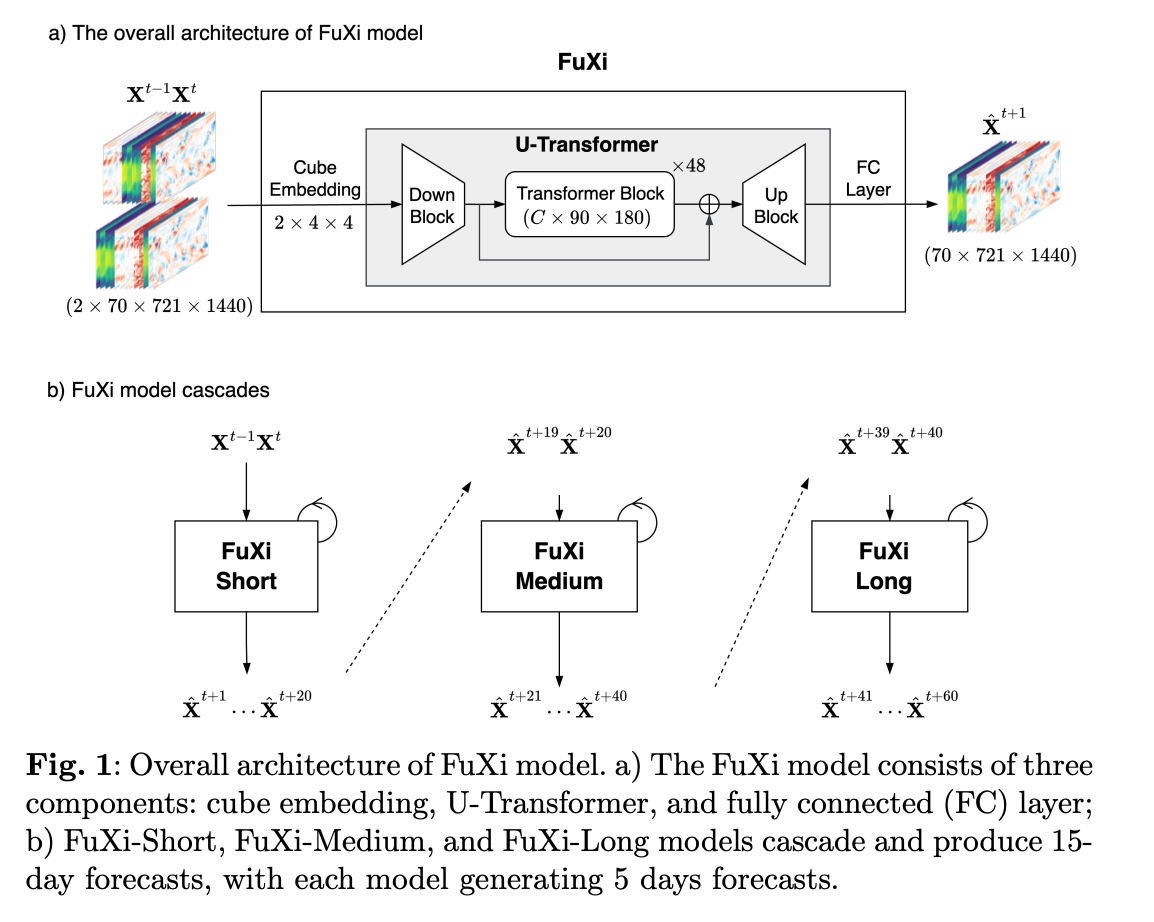
The overall structure of the model is shown in the figure:
The FuXi model uses the fifth generation ECMWF reanalysis dataset ERA5. This dataset provides hourly data on surface and upper-air parameters from January 1940 to the present. The ERA5 dataset is generated by assimilating high-quality and abundant global observations using ECMWF's Integrated Forecast System (IFS) model. ERA5 data is widely considered a comprehensive and accurate reanalysis archive, making it suitable as ground truth for training the FuXi model. For the FuXi model, a subset of the ERA5 dataset spanning 39 years with 0.25° spatial resolution and 6-hour temporal resolution was used. The model aims to predict 5 upper-air atmospheric variables at 13 pressure levels and 5 surface variables. The dataset is divided into training, validation, and test sets. The training set contains 54,020 samples from 1979 to 2015, the validation set contains 2,920 samples from 2016 and 2017, and the out-of-sample test set contains 1,460 samples from 2018. In addition, two reference datasets HRES-fc0 and ENS-fc0 were created to evaluate the performance of ECMWF High-Resolution Forecast (HRES) and Ensemble Mean (EM).
2. Model Principle
The FuXi model is an autoregressive model that uses weather parameters from the previous two time steps (\(X^{t-1}\), \(X^t\)) as input to predict weather parameters for the next time step (\(X^{t+1}\)). Where t, t-1, and t+1 represent the current, previous, and next time steps, respectively. The time step used in this model is 6 hours. By using the model's output as input for subsequent predictions, the system can generate forecasts for different forecast lead times.
Generating a 15-day forecast using a single FuXi model requires 60 iterations. Unlike physics-based NWP models, pure data-driven ML models lack physical constraints, which can lead to significant error growth and unrealistic forecast results in long-term forecasts. Using autoregressive multi-step loss can effectively reduce cumulative errors in long-term forecasts. This loss function is similar to the cost function used in the 4D-Var data assimilation method, which aims to identify initial weather conditions that best fit observations within the assimilation time window. Although increasing the number of autoregressive steps can improve the accuracy of long-term forecasts, it also reduces the accuracy of short-term forecasts. Furthermore, similar to increasing the assimilation time window of 4D-Var, increasing the number of autoregressive steps requires more memory and computational resources to handle gradients during training.
When making iterative forecasts, error accumulation is inevitable as the forecast lead time increases. Furthermore, previous studies have shown that a single model cannot achieve optimal performance across all forecast lead times. To optimize performance for both short-term and long-term forecasts, the paper proposes a Cascade model architecture using pre-trained FuXi models that are fine-tuned to achieve optimal performance within specific 5-day forecast time windows. These time windows are referred to as FuXi-Short (0-5 days), FuXi-Medium (5-10 days), and FuXi-Long (10-15 days). The outputs of FuXi-Short and FuXi-Medium are used as inputs for FuXi-Medium and FuXi-Long at step 20 and step 40, respectively. Unlike the greedy hierarchical temporal aggregation strategy used in Pangu-Weather (which utilizes 4 models predicting 1-hour, 3-hour, 6-hour, and 24-hour forecast lead times respectively to reduce steps), the Cascade FuXi model does not have the problem of temporal inconsistency.
The model architecture of the base FuXi model consists of three main parts, as stated in the paper: Cube Embedding, U-Transformer, and Fully Connected (FC) layer. The input data combines upper-air and surface variables and creates a data cube with dimensions 2×70×721×1440, where 2 represents the previous two time steps (t-1 and t), 70 represents the total number of input variables, and 721 and 1440 represent latitude (H) and longitude (W) grid points respectively.
First, the high-dimensional input data is reduced to C×180×360 through joint spatiotemporal Cube Embedding, where C is the number of channels, set to 1536. The main purpose of Cube Embedding is to reduce the temporal and spatial dimensions of the input data and reduce data redundancy. Subsequently, the U-Transformer processes the embedded data and uses a simple FC layer for prediction. The output result is first reshaped to 70×720×1440, and then restored to the original input shape 70×721×1440 through bilinear interpolation.
The U-Transformer is built from 48 repeated Swin Transformer V2 blocks and computes scaled cosine attention as follows:
Where B represents relative position bias, which is a learnable scalar and is not shared between different heads and layers. The cosine function is naturally normalized, which results in smaller attention values.
The model uses pre-trained weights for inference. Next, the inference process of the model will be introduced.
3. Model Construction
In this case, FuXiPredictor is implemented for inference of the ONNX model:
FuXi adopts a cascade model structure, predicting three consecutive forecast periods (0-5 days, 5-10 days, and 10-15 days) through fuxi_short.yaml, fuxi_medium.yaml, and fuxi_long.yaml.
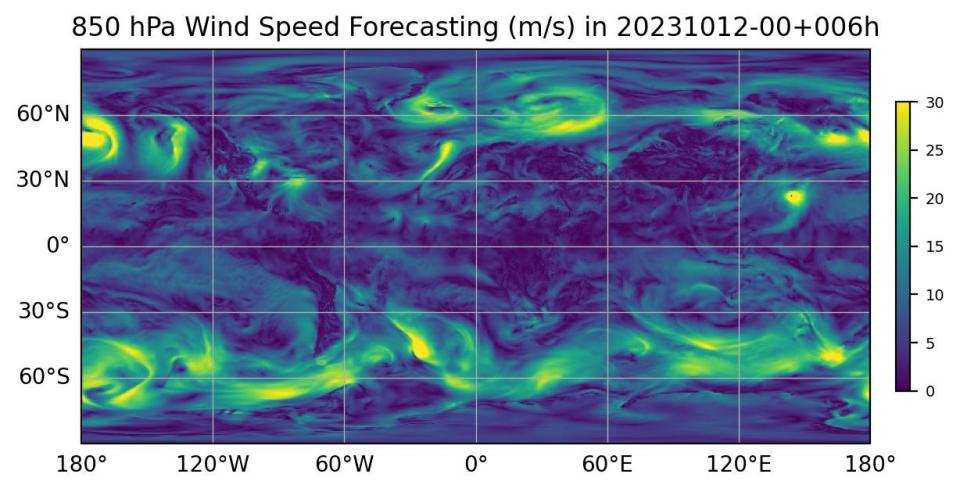
4. Result Visualization
Use examples/fuxi/visualize.py for plotting and result visualization.
5. Complete Code
| examples/fuxi/predict.py | |
|---|---|
1 2 3 4 5 6 7 8 9 10 11 12 13 14 15 16 17 18 19 20 21 22 23 24 25 26 27 28 29 30 31 32 33 34 35 36 37 38 39 40 41 42 43 44 45 46 47 48 49 50 51 52 53 54 55 56 57 58 59 60 61 62 63 64 65 66 67 68 69 70 71 72 73 74 75 76 77 78 79 80 81 82 83 84 85 86 87 88 89 90 91 92 93 94 95 96 97 98 99 100 101 102 103 104 105 106 107 108 109 110 111 112 113 114 115 116 117 118 119 120 121 122 123 124 125 126 127 128 129 130 131 132 133 134 135 136 137 138 139 140 141 142 143 144 145 146 147 148 149 150 151 152 153 154 155 156 157 158 159 160 161 162 163 164 165 166 167 168 169 170 171 172 173 174 175 176 177 178 179 180 181 182 183 184 185 186 187 188 189 | |
6. Result Display
The model inference result contains 60 NetCDF files, representing meteorological data for 20 time steps of each model within the next 15 days starting from the prediction time point.
Use examples/fuxi/visualize.py for plotting and result visualization.
The figure below shows: